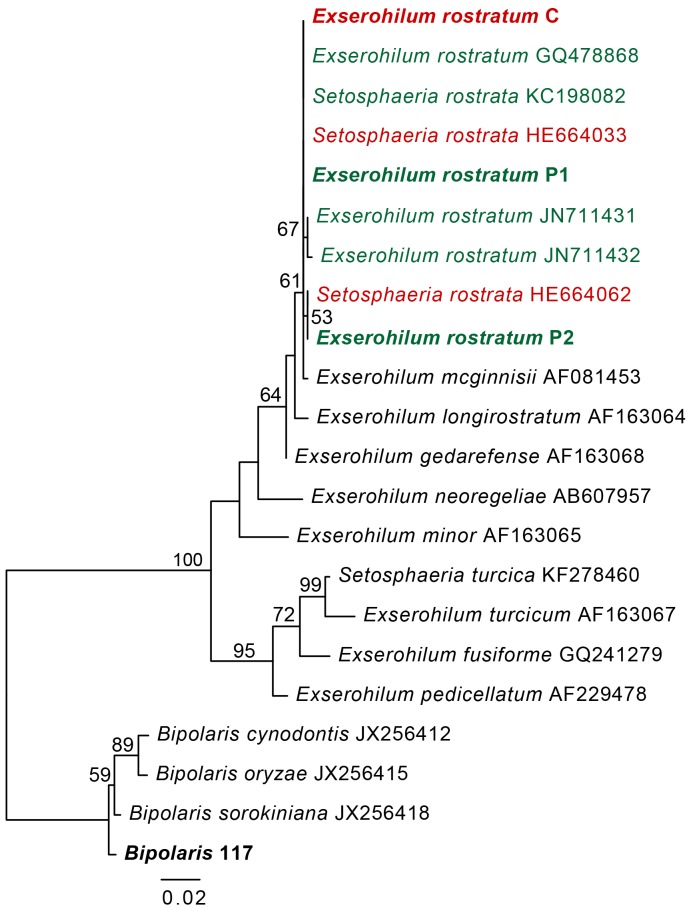
Figure 2. Maximum likelihood phylogeny of the Exserohilum and Bipolaris isolates relative to other E. rostratum clinical and plant isolates and Exserohilum species.
Isolates used in this study are shown in bold. E. rostratum isolates from plants are shown in green and clinical isolates are shown in red. Bootstrap values are shown for branches with values greater than 50%. Branch lengths are in substitutions per site.

