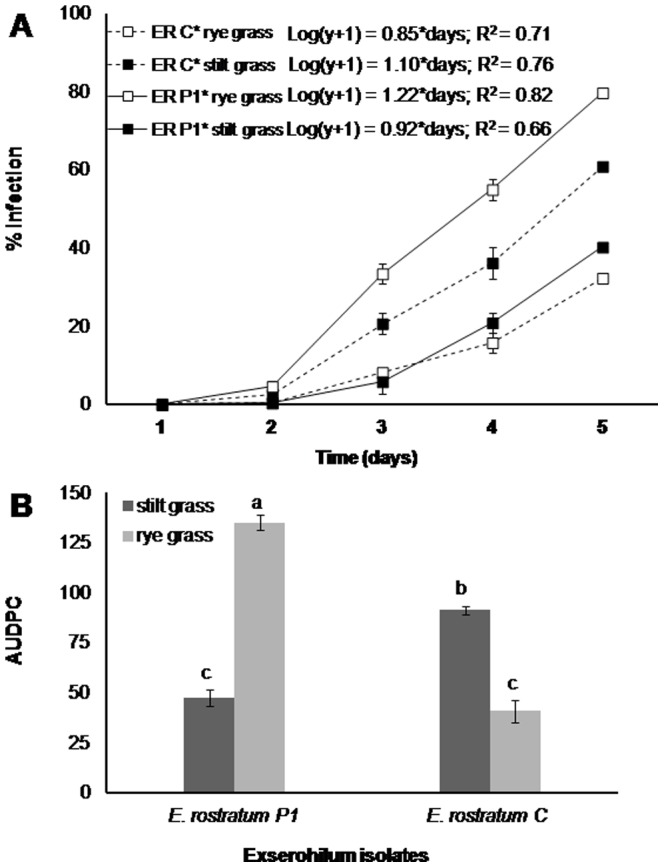
Figure 5. Reaction of stilt grass and rye grass to a clinical (ER C) and plant (ER P1) isolate of Exserohilum rostratum expressed as % infection over time (A) and area under disease progress curve (B) in the second experiment.

Prior to regression analysis, diseased area data were log-transformed, but nontransformed means are presented in the figure for uniformity of presentations. Data are the means ± SE of two repetitions of the study, each with four replications (four per rep per treatment, five plants per pot). Significant differences are marked with different letters above bars (P≤0.05, Tukey-test).
