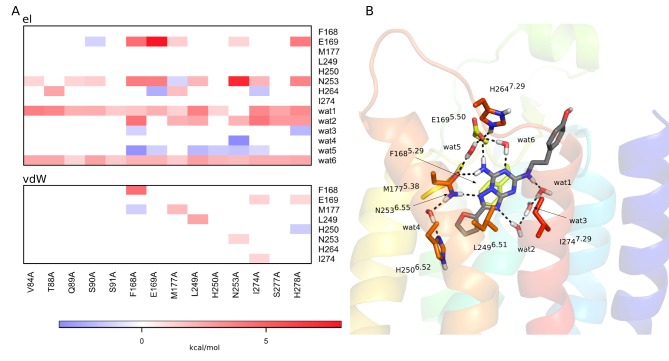
Figure 3. Correlation of ligand interaction energies with alanine mutations for the A2AAR−ZM241385 complex.
(A) Correlation diagram showing the change in non-bonded interaction energies (electrostatic – top, van der Waals – bottom) for relevant binding site residues (y-axis) upon a given alanine mutation (x-axis). Only residues with any absolute interaction energy change above 1 kcal/mol are shown, where the water molecules are present throughout the MD simulations and also observed in the crystal structure. (B) The corresponding affected residues and water molecules are shown in sticks for the initial 3D structure of the complex.

