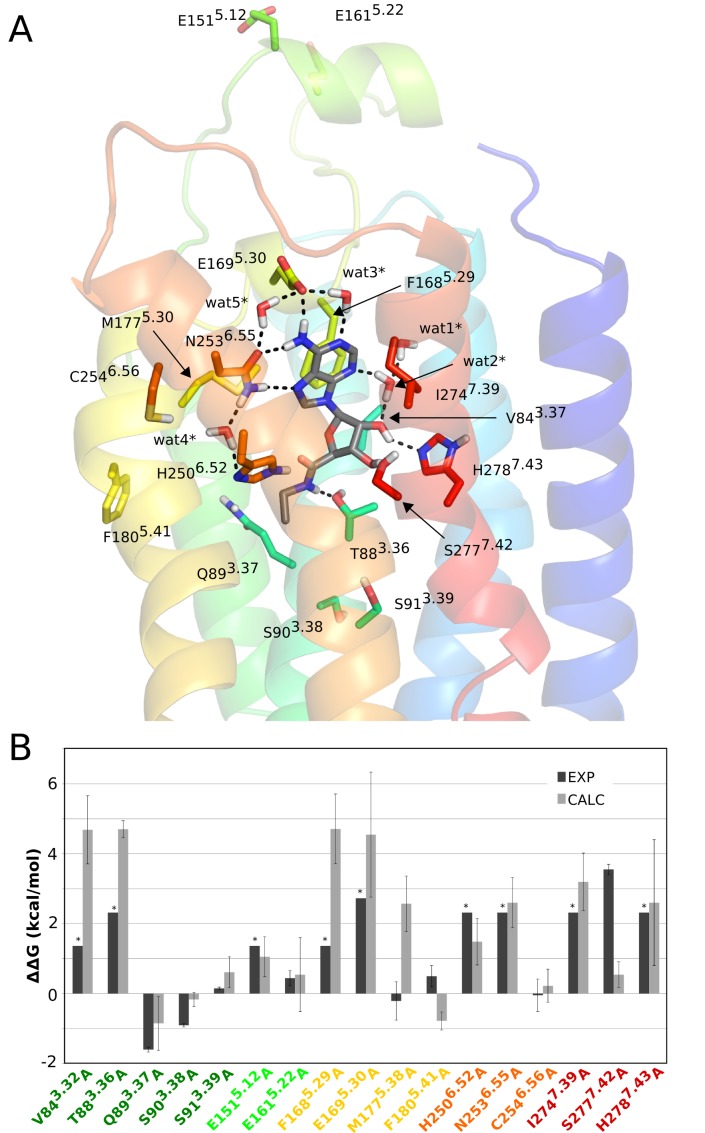
Figure 4. Structure of the A2AAR*−NECA complex and relative binding free energies for mutants.
(A) Starting structure used for the FEP simulations, with explicit representation of residues subjected to alanine mutation and crystal water molecules as in Figure 2. (B) Calculated (light gray bars) and experimental (black bars) relative binding free energies (kcal/mol) for the seventeen A2AAR* alanine mutants compared to the wt receptor. The star symbol denotes that an experimental value could not be determined and approximates the detection threshold of the experiment.

