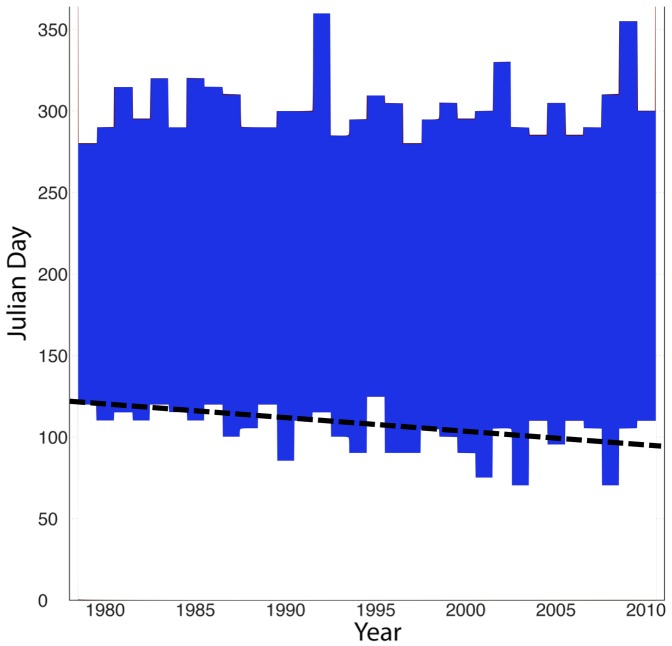
Figure 7. Increased Inter-annual Variability and Total Precipitation.
Precipitation data at the study site shows inter-annual variability from 1979 through 2010. The shaded section of the figure represents the period comprising 90% of annual rainfall. In addition to increasing variability since 1990, the monsoon season is arriving earlier as indicated by the downward shift of the trend line.

