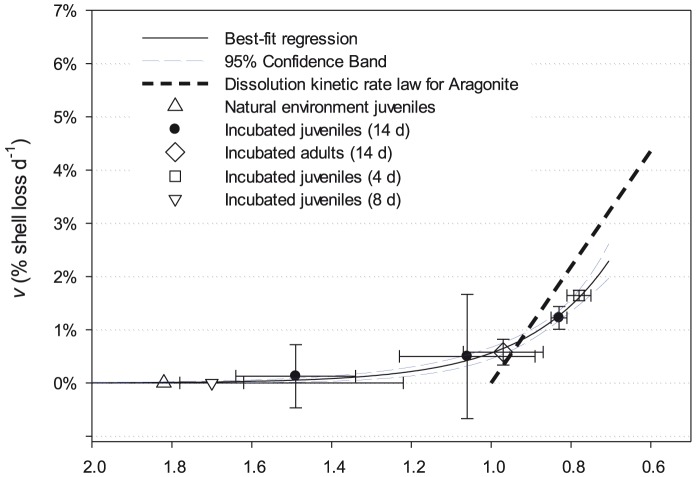
Figure 7. Percentage of shell mass loss across a range of aragonite saturation states.
Shell mass loss d−1 (v) in live and dead specimens incubated between 4 and 14 days. Solid line represents a 2-parameter exponential function (±95% confidence intervals) fitted to all live specimens’ data points. The bold hashed line represents the dissolution kinetic rate law for aragonite. Error bars show ±1 SD on ΩA values in the incubations and v respectively.

