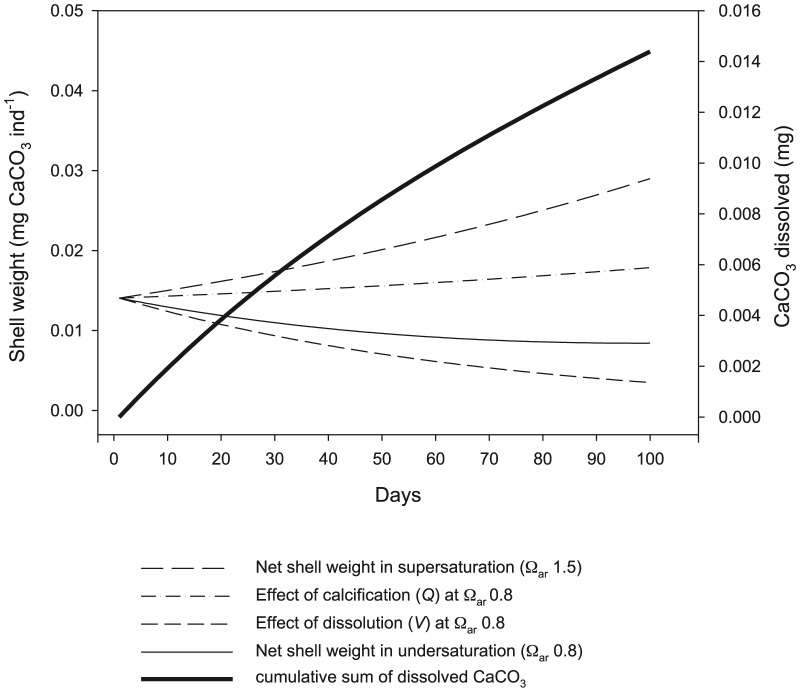
Figure 8. Simulation of dissolution and calcification on the shell weight exposed to supersaturation and undersaturation conditions.
Simulation of the effect of dissolution and calcification on the shell weight when exposed to supersaturation or undersaturation conditions for 100 days. Bold line indicates the amount of CaCO3 dissolved over the course of the simulation where Ωar is 0.8.

