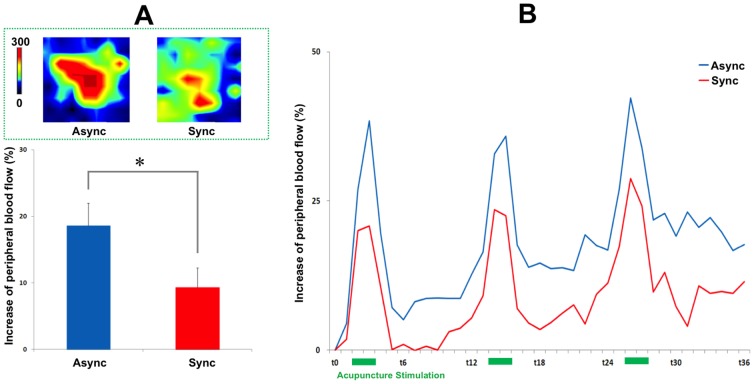
Figure 2. Peripheral responses to acupuncture stimulation during the RHI.
A representative example of the peripheral responses to acupuncture stimulation around the LI4 acupoint (2×2 cm) is shown in upper column A. The increase in peripheral responses to acupuncture stimulation was significantly different between the synchronous and asynchronous brush-stroke sessions, as seen in lower column A (18.6±3.3 vs. 9.3±2.8%, t = 2.544, P<0.05). Peripheral responses to acupuncture stimulation are presented as the mean peripheral blood-flow change over time. Values are means ± standard errors.

