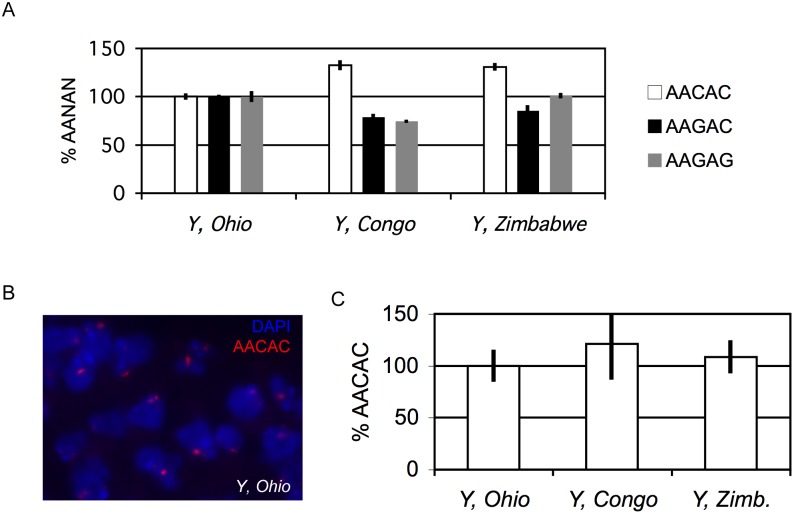
Figure 3. Quantification of Y-linked satellite copy number variation in geographically divergent lines.
DNA and tissue samples obtained from males bearing Y chromosomes originally isolated from wild-caught flies. The genetic background of these males was otherwise isogenic. (A) Relative quantification of satellite copy number using qPCR. Percentages are relative to Y, Ohio (defined as 100%). Error bars represent standard error of the mean (S.E.M.) of triplicate qPCR reactions. (B) Fluorescence in situ hybridization to detect AACAC repeats (red) in squashed neuroblast cells derived from Y, Ohio larvae. DAPI stains DNA blue. (C) Quantification of in situ hybridization signals. Percentages calculated relative to Y, Ohio (defined as 100%). Error bars represent standard deviation (S.D.) of nuclei from thirty neuroblasts from each of three separate preparations per genotype (N = 90).

