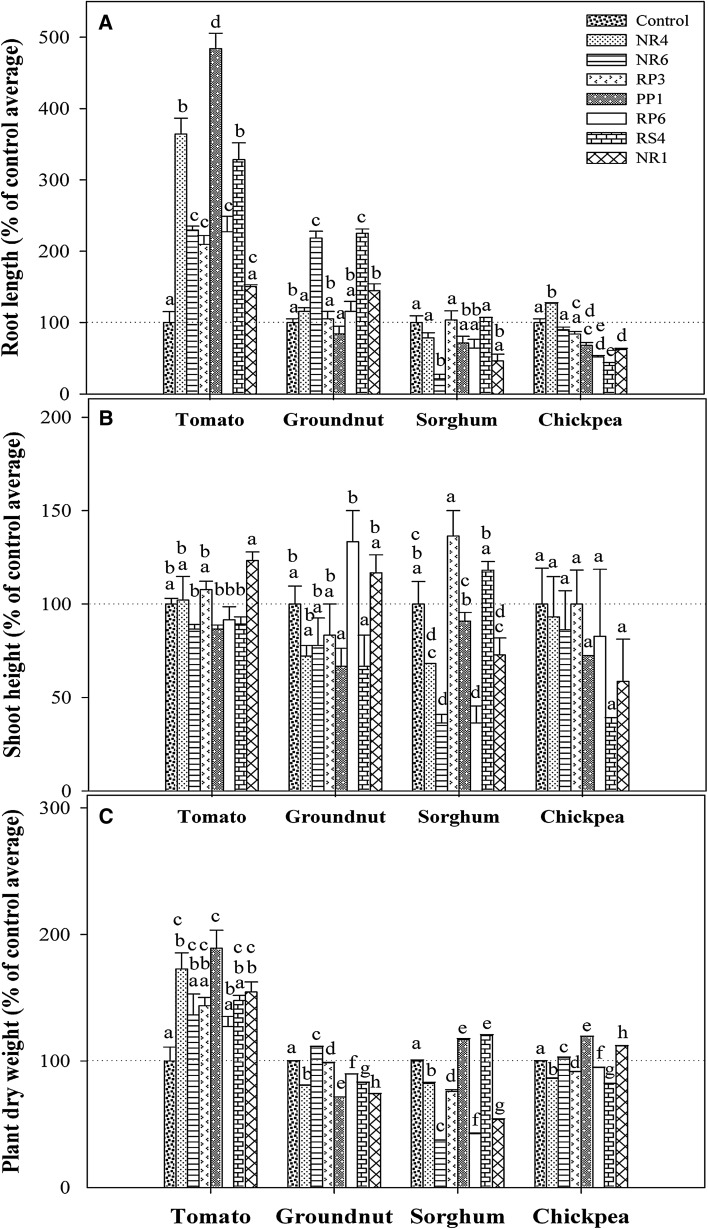
Fig. 3.
Influence of seven bacterial isolates on four crop plant responses: the root length (a), shoot height (b), and dry weight (c). The corresponding values were different for each plant; to compare the effects of a variety of isolates on different plants, actual values were converted to % of control values. Reported values are means (n = 3) and vertical lines are ±1 standard error of the mean. Using % of control values, two- way ANOVA along with Tukey’s HSD post hoc tests was performed for each of the growth response i.e., root length; shoot height; or dry weight using plant-type and isolate-type as two factors. In addition, the interaction between plant-type and isolate-type was tested. Subsequently, the group of bars i.e., the response of each plant treated with or without the isolates was separately analyzed using one-way ANOVA followed by Tukey’s HSD test for multiple mean comparisons, α = 0.05. Levels not connected by same letter are significantly different

