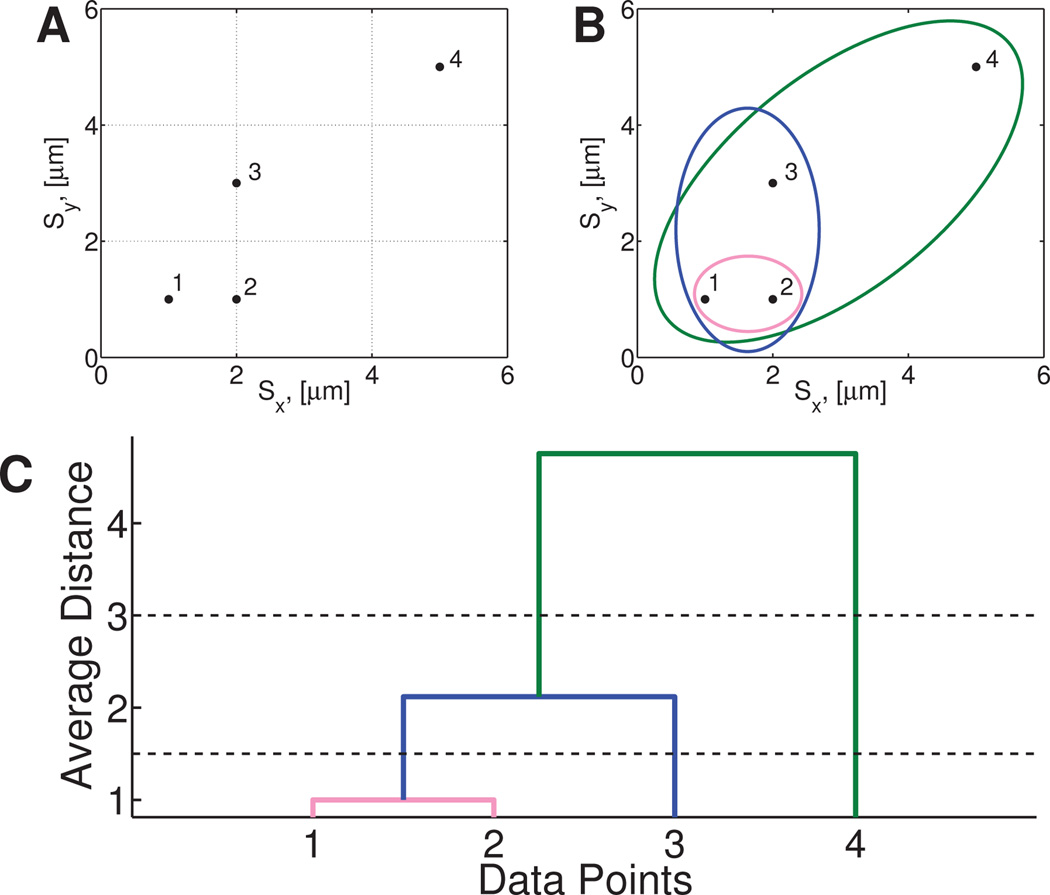
Fig. 1. Example of hierarchical clustering.
A) The distribution of data points to be clustered. Each data point is assigned to a cluster containing only itself. The pairwise distances between all clusters are calculated and the closest two clusters are merged to form a new cluster. B) This process is repeated until all data points are in a single cluster. C) A dendrogram shows the distances between each cluster and the order in which they were merged. The solid lines at 3 and 1.5 show cutoff values that produce two and three clusters, respectively.

