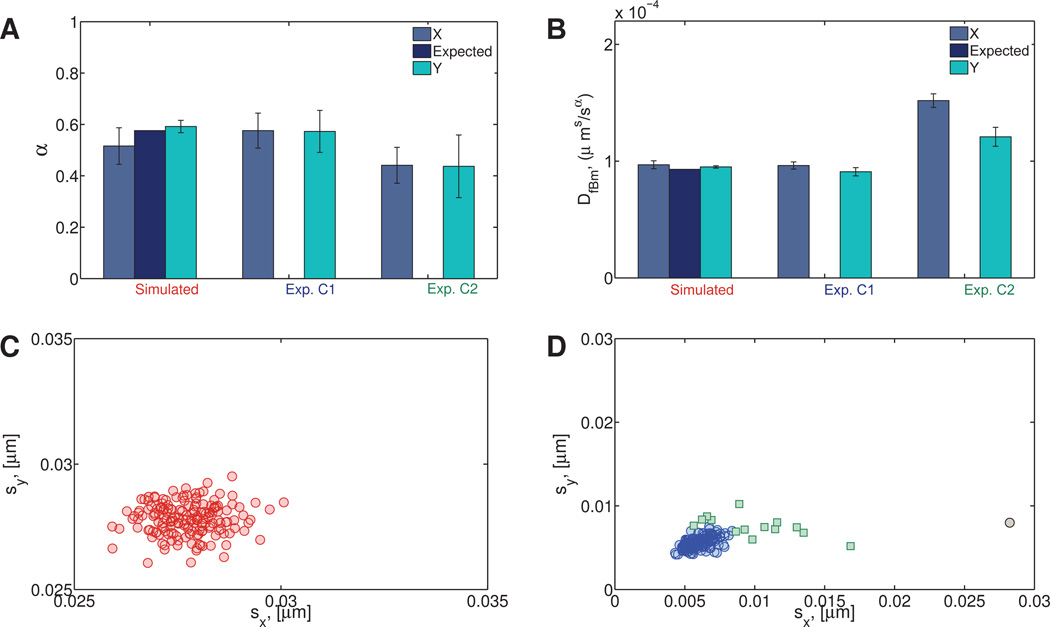
Fig. 11. Simulated and experimental (hyaluronic acid) homogeneous viscoelastic data.
A) Power law exponent and B) fractional diffusion coefficient distributions. C) Standard deviations of simulated data. D) Standard deviations of experimental data. For the experimental hyaluronic acid data, the main cluster (denoted Exp. C1) contains 161 data points and is shown in blue (open circles). The second cluster (Exp. C2) contains 14 data points and is shown in green (open squares). One statistically distinct outlier was also found (gray circle).

