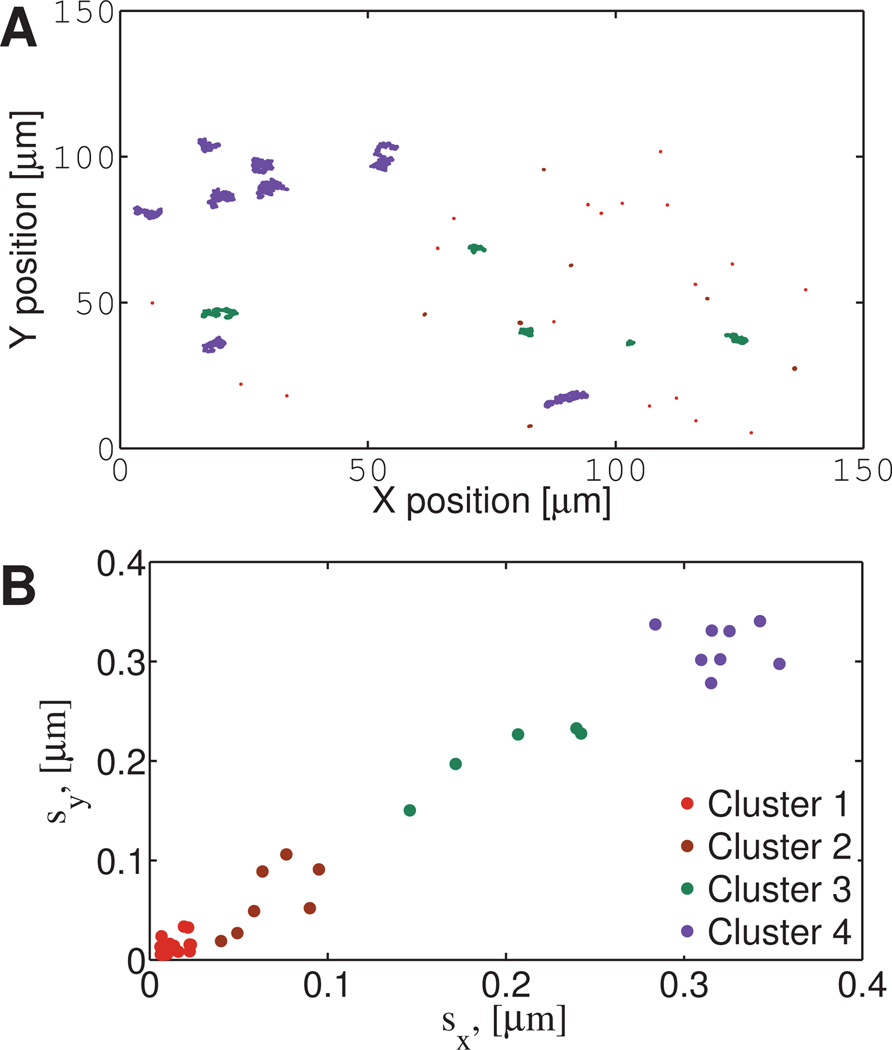
Fig. 14. Experimental Agarose data: position time series in physical space and results of cluster analysis.
1 µm diameter beads diffusing in 0.2% w/w agarose. A) Particle paths in two space dimensions of the microscope focal plane, with color coding inserted after cluster analysis. B) Results from the clustering algorithm, revealing four clusters. Cluster assignments are then carried back to the physical locations in the focal plane in Figure 14A

