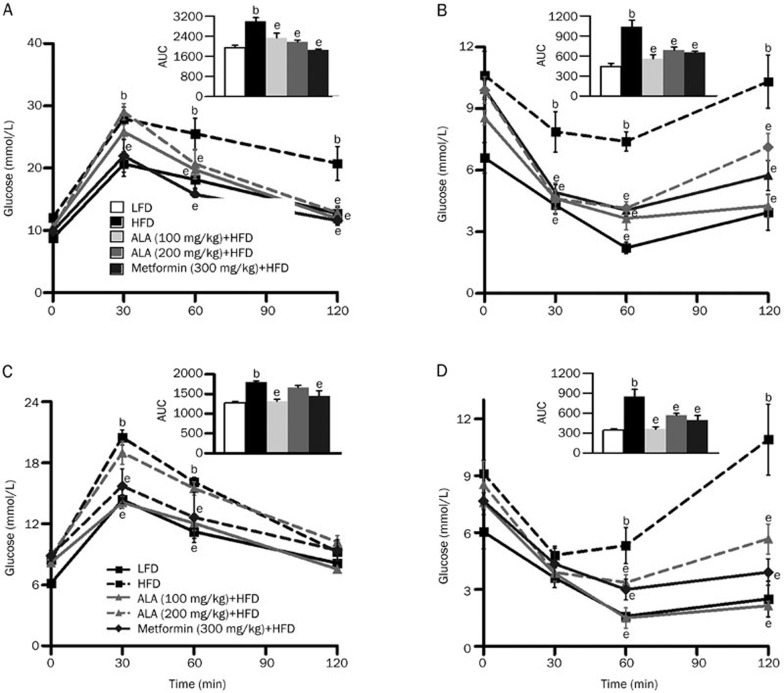
Figure 3.
Effect of ALA on glucose and insulin tolerance. (A and C) Intraperitoneal injection glucose tolerance test (IPGTT) of 13 or 24-week-old HFD-fed mice relative to ALA or metformin-administered mice (n=6 per group). Inset: The IPGTT is shown as the area under the curve (AUC). (B and D) Intraperitoneal injection insulin tolerance test (IPITT) of 13 or 24-week-old HFD-fed mice relative to ALA or metformin-administered mice (n=6 per group). Inset: The IPITT is shown as the AUC. Mean±SEM. bP<0.05 vs LFD. eP<0.05 vs HFD.

