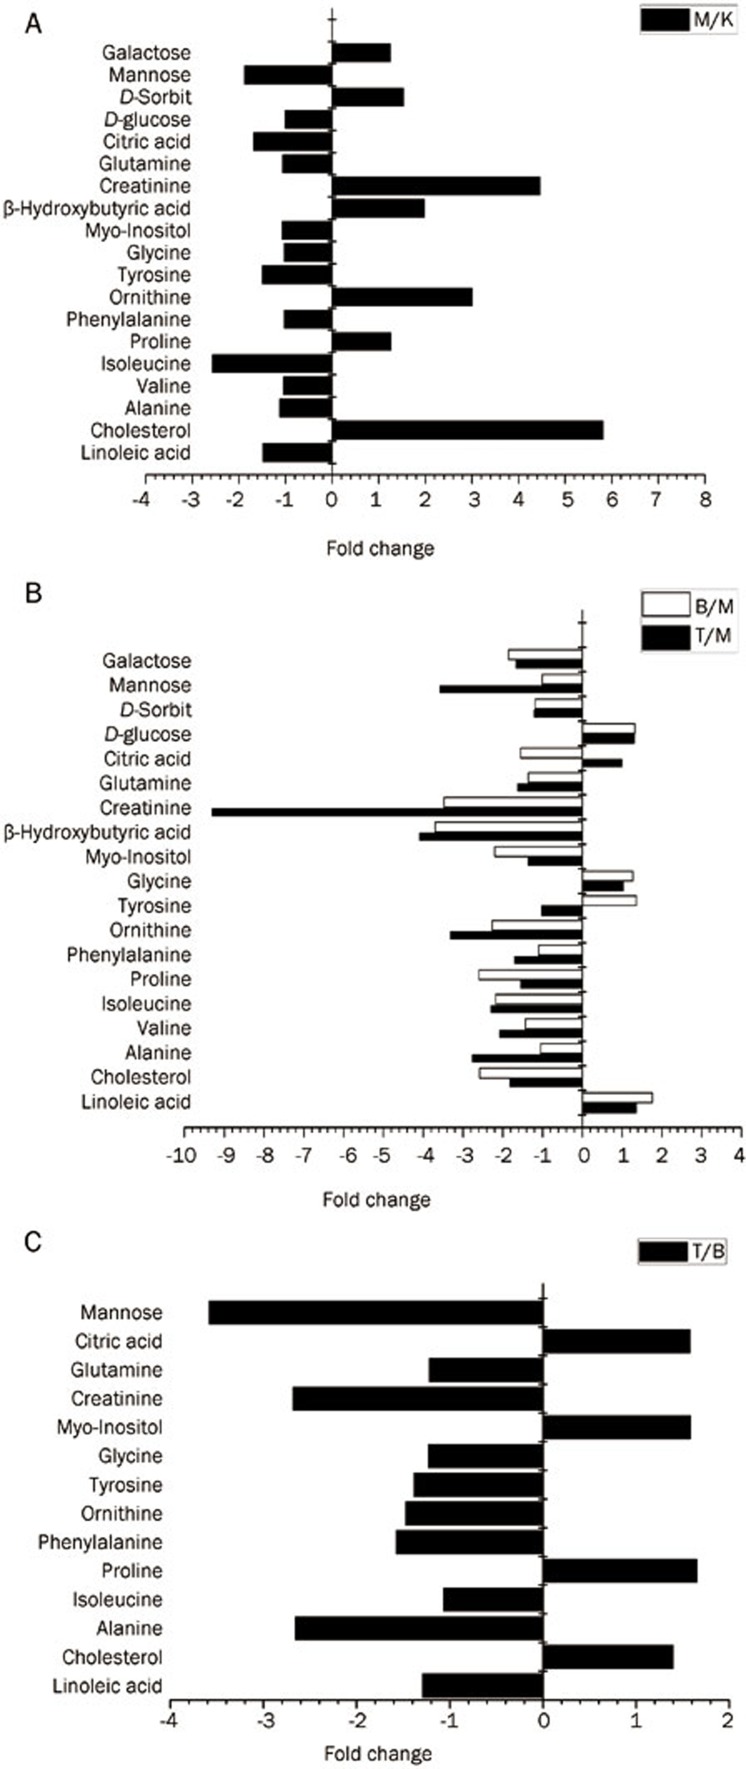
Figure 6.
The relative fold changes of plasma metabolite levels at 6th week. Different groups of rats are represented using the following notation: (A) the model control group (M) versus the normal control group (K); (B) the simvastatin treatment group (T) or fenofibrate treatment group (B) versus the model control group (M); (C) the simvastatin treatment group (T) versus the fenofibrate treatment group (B).

