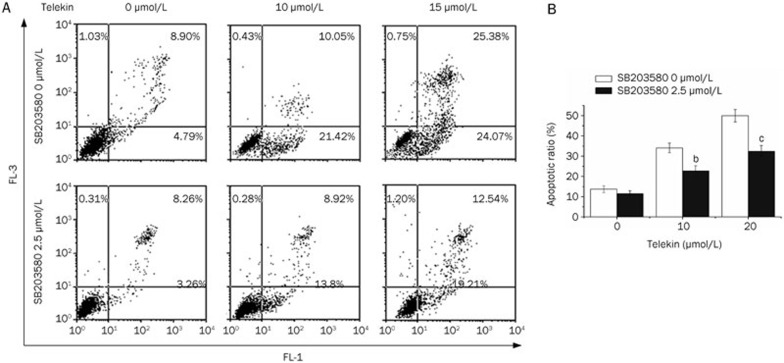
Figure 10.
Inhibition of p38 decreased telekin-induced apoptosis. (A) Representative apoptotic profile of HepG2 cells treated with or without telekin and SB203580 by flow cytometric analysis. (B) Quantification of telekin induced-apoptosis was performed using flow cytometric analysis. Histograms were obtained from triplicate experiments. bP<0.05, cP<0.01 vs 0 μmol/L SB203580 group.

