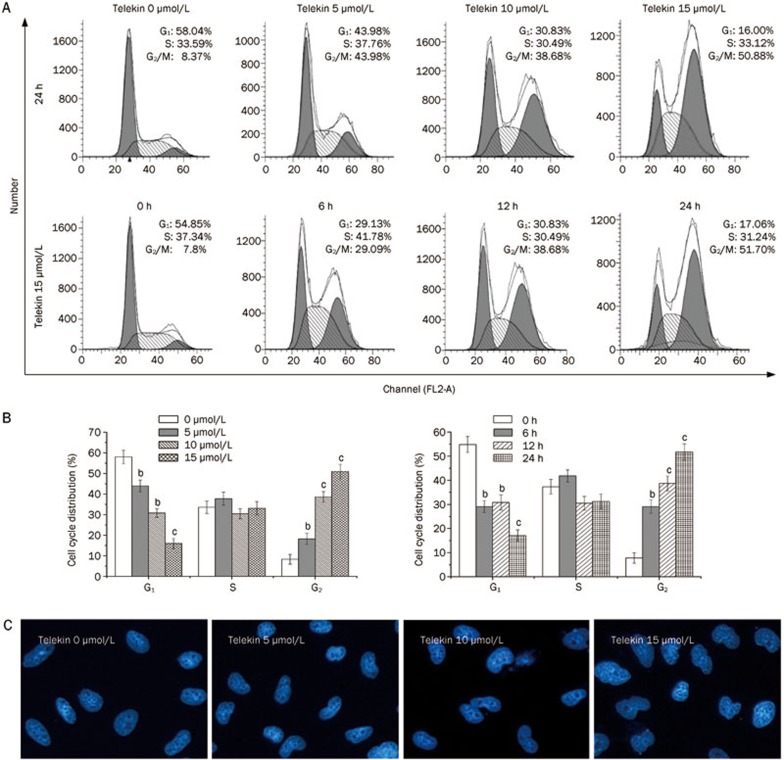
Figure 2.
Telekin-induced cell-cycle arrest at the G2/M phase. HepG2 cells were treated for 24 h with various concentrations of telekin (0–15 μmol/L) or with 15 μmol/L telekin for various times (0–24 h). (A) The cell cycle distribution was measured using flow cytometry. (B) The histograms indicate the cell cycle distribution in HepG2 cells treated with telekin. bP<0.05, cP<0.01 vs 0 μmol/L telekin group. (C) HepG2 cells were stained with DAPI to determine the morphology of nucleus. Treatment with telekin resulted in nuclei unable to segregate after DNA replication. DAPI: 4′,6-diamidino-2-phenylindole.

