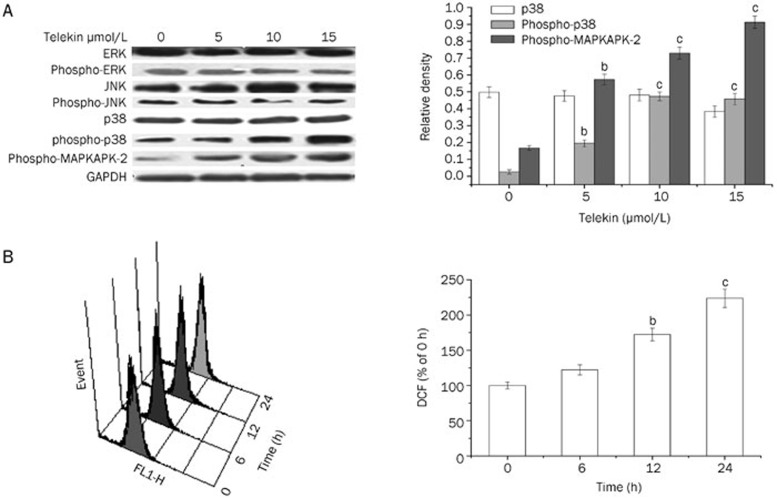
Figure 4.
Telekin induced protein activation and ROS generation. (A) Telekin induced the activation of p38 MAPK. Cells treated with 0, 5, 10, and 15 μmol/L of telekin for 24 h were subjected to Western blotting assay. Telekin induced an increase in phospho-p38 and phospho-MAPKAPK-2 level in a dose-dependent manner. However, the levels of ERK, phospho-ERK, JNK, and phospho-JNK did not change notably. The corresponding histograms quantified by densitometry are presented on the right. bP<0.05, cP<0.01 vs 0 μmol/L telekin group. (B) The representative ROS pattern and the corresponding histograms of HepG2 cells were examined by flow cytometric analysis. The fluorescence intensity of cells without telekin treatment was set as 100% (0 h telekin group). bP<0.05, cP<0.01 vs 0 h telekin group.

