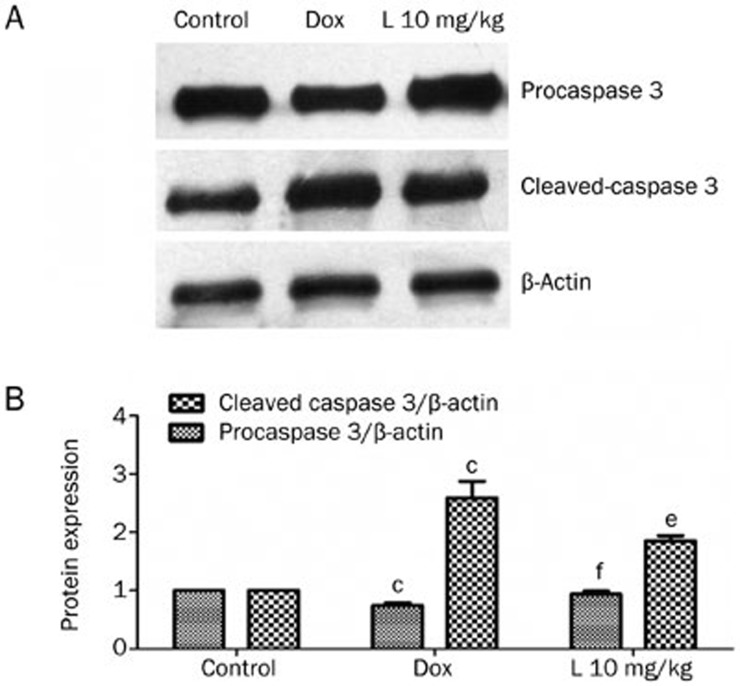
Figure 6.
The expression of pro-caspase-3 and cleaved-caspase-3 using Western blot assays. (A) Pro-caspase-3 and cleaved-caspase-3 protein expression as determined by Western blot assays. (B) SDS/PAGE analysis demonstrates changes in cleaved-caspase-3 and pro-caspase-3 protein expression levels. bP<0.05, cP<0.01 vs the control group. eP<0.05, fP<0.01 vs the DOX group (n=3).

