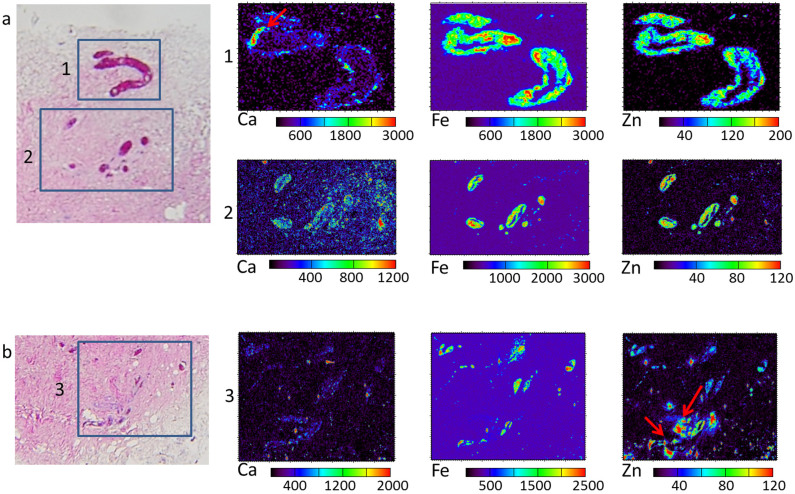
Figure 2. XRF elemental maps at 12.74 keV in MS2 tissue jugular sections.
Three consecutive tissue sections of MS2 sample are used: two unstained for XRF analyses and one HH stained for tissue structure recognition. a) and b): light microscopy images, the boxes indicate the selected regions for XRF analyses in the unstained sections. The corresponding elemental maps of Ca, Fe and Zn of regions 1, 2 and 3 acquired at the XFM beamline at 12.74 keV with 2 μm spatial resolution on the corresponding unstained tissue slices are shown in rows 1, 2 and 3 respectively. Red arrow in Ca map (1) indicates a calcification further analyzed at 4.12 keV. Arrows in Zn map indicate potential contaminants and tissue debris. The concentrations reported on the scale bars are in ppm. Region 1: 250 μm × 170 μm; Region 2: 600 μm × 400 μm; Region 3: 700 μm × 600 μm.

