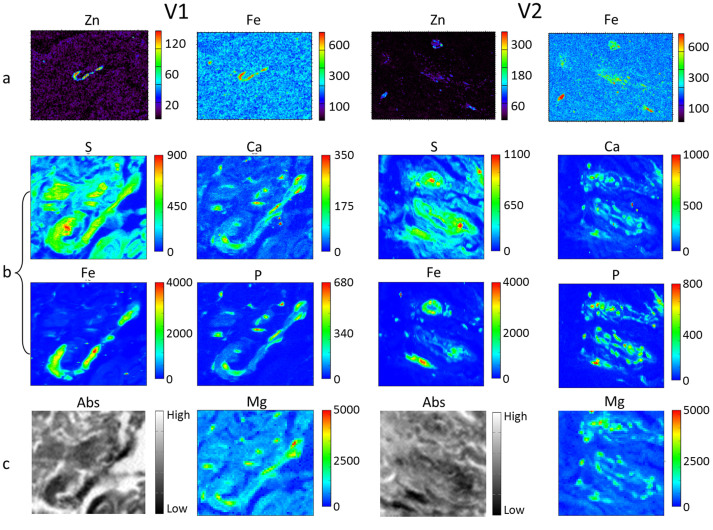
Figure 5. XRF analysed of microvessels in control tissues.
Panels a: Elemental maps of Zn and Fe acquired at 12.74 keV and 2 μm spatial resolution (a-V1 area: 600 μm × 450 μm, 15 ms/pixel; a-V2 area: 300 μm × 225 μm, 15 ms/pixel). Panels b: Elemental maps of S, Ca, Fe and P acquired at 7.2 keV and 0.5 μm spatial resolution (B-V1 area: 80 μm × 70.5 μm; b-V2 area: 100 μm × 100 μm both 300 ms/pixel). Panels c: Absorption (Abs) image and corresponding Mg elemental map investigated at 1.5 keV and 0.5 μm spatial resolution (both areas 80 μm × 80 μm, 10 s/pixel).

