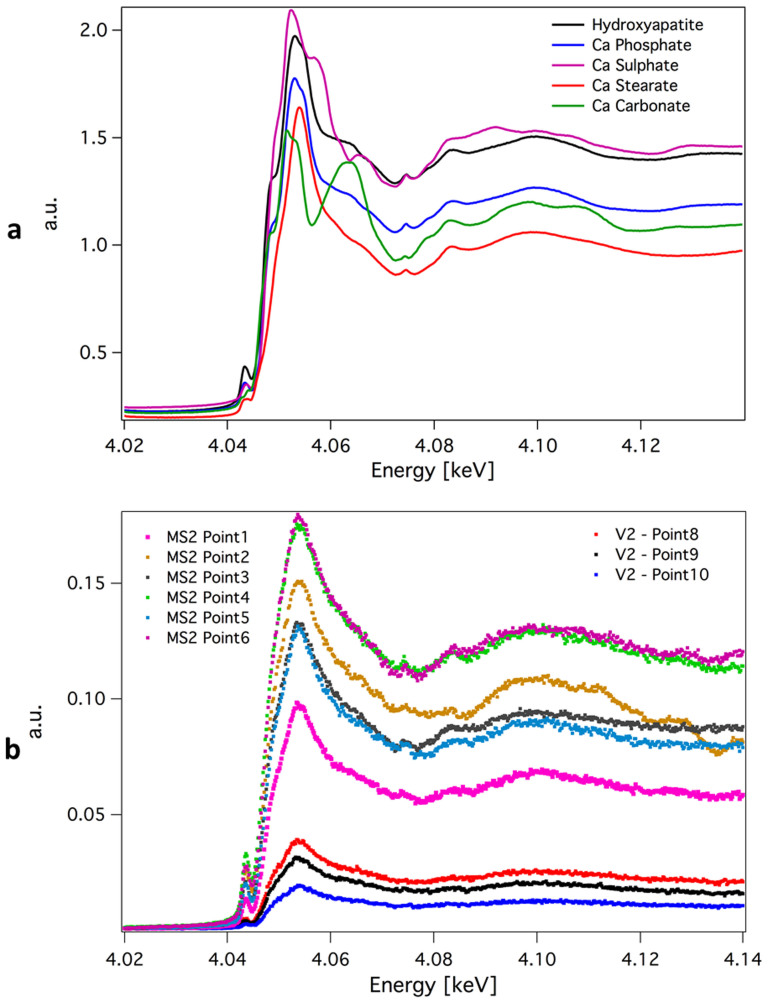
Figure 7. XANES spectra across Ca K edge.
Panel a show the XANES spectra of the standard samples across Ca K edge. Panel b depicts the XANES spectra collected on samples MS2 and V2, in the same points indicated with the same numbers in Figure 6. In the case of sample V2 spectra the linear combination fitting performed with the Athena software using the reference standard attributes 41–47% in composition to Ca Stearate, 24–29% to Hydroxyapatite, 6–7% Ca Carbonate and 17–28% Ca Sulphate. For MS samples the fitting gives different compositions: 0–19% Ca Stearate, 56–64% to Hydroxyapatite, 0–9% Ca Carbonate and 19–27% Ca Sulphate.

