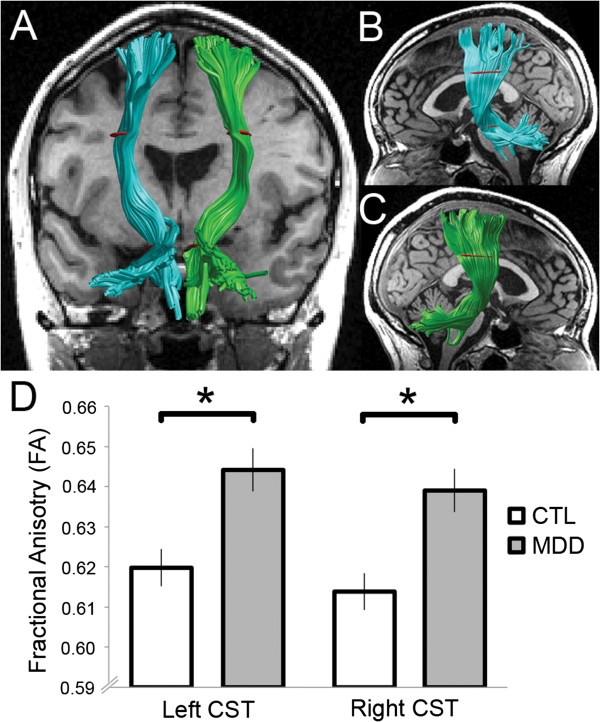
Figure 1.
AFQ corticospinal tracts. Corticospinal tracts (CSTs) rendered for an example subject. Three hundred fibers were rendered for each tract. The left CST is colored teal and the right CST green. Waypoint regions of interest (ROIs) are depicted in red. Fractional anisotropy (FA) computed for the fiber tract core, between the waypoint ROIs, was meaned and compared between groups. (A) Bilateral CSTs viewed posteriorly with a T1-weighted coronal slice at the anterior commissure. (B) Left CST and (C) right CST viewed laterally with a mid-sagittal T1-weighted slice. (D) Group differences in mean CSTs. Asterisks indicate statistical significance from two-sample t-tests between groups. Error bars represent standard error of the mean (SEM). See Table 4 for group means and standard deviations. AFQ automated fiber quantification, CTL control group, MDD depressed group.

