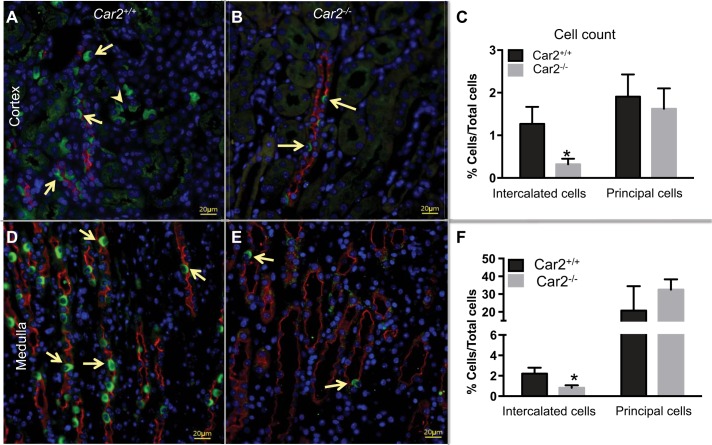
Fig. 2.
Quantification of intercalated cells (ICs). ICs were identified by immunofluorescence for V-ATPase immune reactivity (green) and colabeled with DAPI (blue) to identify nuclei and aquaporin 2 (red) to identify collecting duct principal cells. Isolated V-ATPase-positive cells (arrows) were identified in the collecting ducts of the cortex (A) and medulla (D) of Car2+/+ mice. ICs (arrows) in the cortex and medulla were present in tubules positive for aquaporin 2, consistent with collecting ducts, and also in isolated tubules negative for aquaporin 2 in the cortex, consistent with connecting segments. In contrast, Car2−/− mice had infrequent cells that stained for V-ATPase in the cortex (B) and medulla (E). C: ICs comprised 1.27 ± 0.40% and 0.32 ± 0.13% of cortical cells in Car2+/+ and Car2−/− kidneys, respectively (P = 0.004). F: medullary ICs decreased from 2.21 ± 0.58% of total cells in Car2+/+ kidneys to 0.83 ± 0.23% in Car2−/− kidneys (P = 0.004). The automated cell count of ICs was performed on four ×20 images from 2 mice. The presented images are at ×40 magnification, with 20-μm scale bars.

