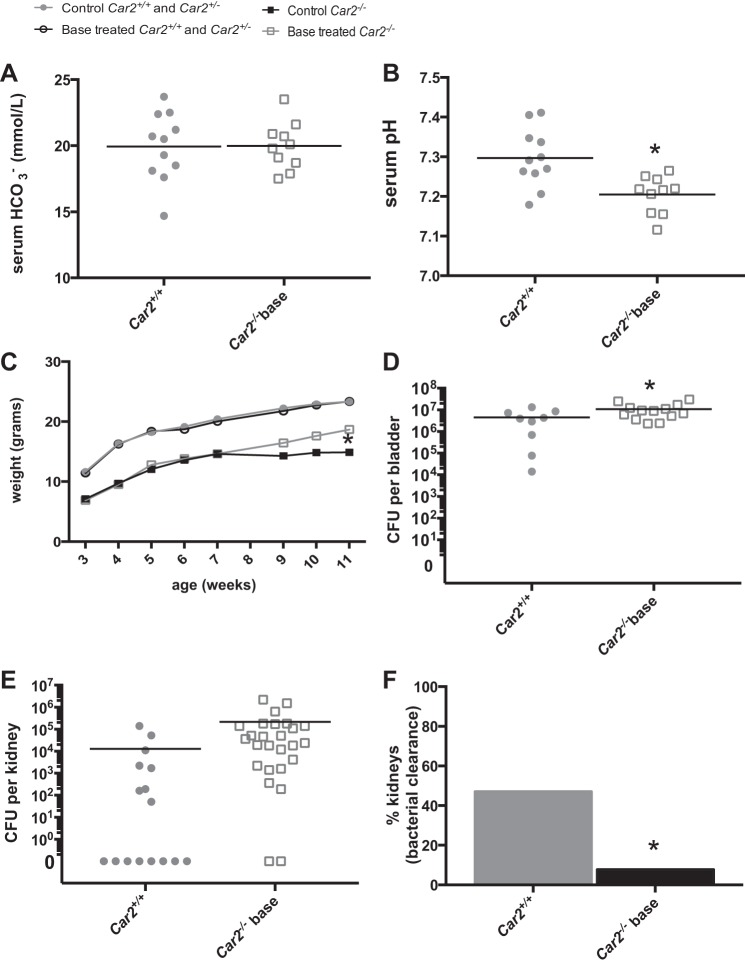
Fig. 5.
Serum HCO3− normalization. A: mean serum HCO3− in base-supplemented Car2−/− mice was 19.98 ± 2.68, consistent with 19.93 ± 2.61 in Car2+/+ mice (P = 0.955). B: serum pH in Car2−/− mice partially corrected from the nonbase-supplemented mean of 7.12 ± 0.03 (Table 2). It was 7.21 ± 0.05 and 7.30 ± 0.07 in base-supplemented Car2−/− and Car2+/+ mice, respectively (P = 0.003). C: Car2−/− mice were smaller at all time points (P < 0.0001). Base-supplemented Car2−/− mice did exhibit significant increased growth at 11 wk (P = 0.047). The growth of Car2−/− mice with (n = 10) and without (n = 9) base supplementation was plotted against the pooled control group of 20 mice with (10 wild-type mice and 10 Car2+/− mice) and without (5 Car2+/+ mice and 15 Car2+/− mice) base supplementation. D: the mean bladder CFU was higher in base-supplemented Car2−/− mice at 1.08 × 10⁷ ± 8.56 × 10⁶ versus 4.53 × 10⁶ ± 4.42 × 10⁶ in Car2+/+ mice (P = 0.0382). E: the mean kidney CFU of 213,329 ± 508,832 in base-supplemented Car2−/− mice was higher than Car2+/+ mice (12,965 ± 36,283), but just missed significance with a P value of 0.056. F: the proportion of kidneys clear of bacteria was lower in base-supplemented Car2−/− mice (2 of 24 mice, 8.3%) than Car2+/+ mice (8 of 16 mice, 50%, P = 0.007).

