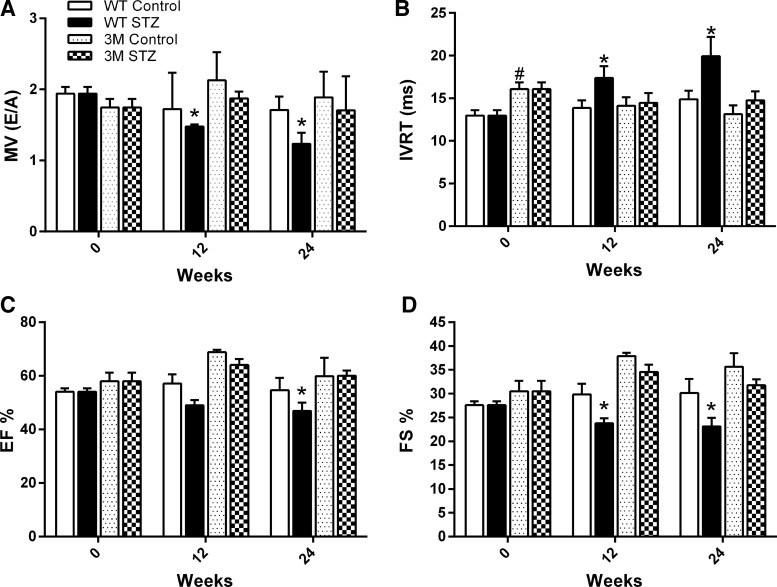
Fig. 2.
Measurement of diastolic and systolic function by echocardiography. Values are echocardiographic parameters in control and diabetic (STZ) WT and 3M mice performed on day 0, week 12, and week 24 after the induction of diabetes. A: ratio of mitral valve flow velocities [MV (E/A)]. B: isovolumic relaxation time (IVRT). C: ejection fraction (EF). D: fractional shortening (FS). Values are expressed as means ± SE; n = 5–7. *P < 0.05 vs. the respective 0-wk time point; #P < 0.05 vs. 0-wk control WT mice.

