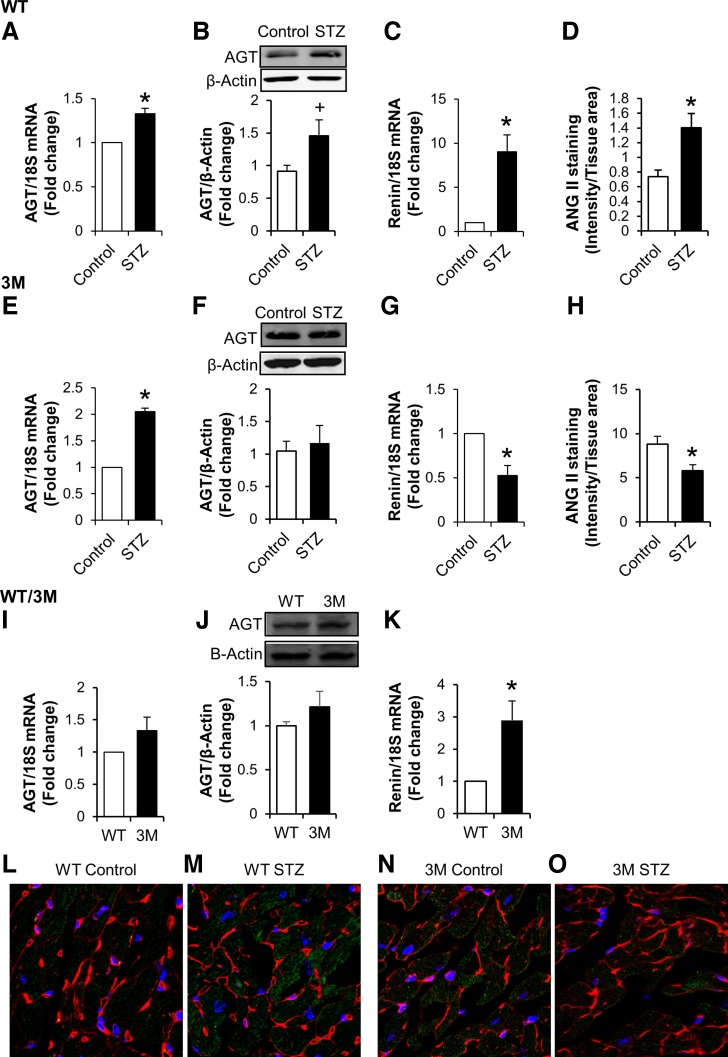
Fig. 7.
Measurement of renin-angiotensin system (RAS) components in the heart. A–H: hearts from control and diabetic (STZ) WT (A–D) and 3M (E–H) mice were used to determine the expression of angiotensinogen (AGT), renin, and ANG II. AGT expression was determined by real-time PCR (A and E) and Western blot analysis (B and F) and normalized to 18S mRNA or β-actin levels, respectively. Renin expression was determined by real-time PCR (C and G). I–K: control samples from WT and 3M mice were analyzed together for baseline comparison. Values are expressed as fold changes compared with control ± SE; n = 4–8. *P < 0.05 and +P < 0. 1 vs. control mice. L–O: immunostaining of heart sections for ANG II (green), WGA (red), and DAPI (blue) from WT and 3M mice. ANG II staining intensity was quantified, normalized to tissue area, and plotted for WT (D) and 3M (H) mice. *P < 0.05 vs. control mice.

