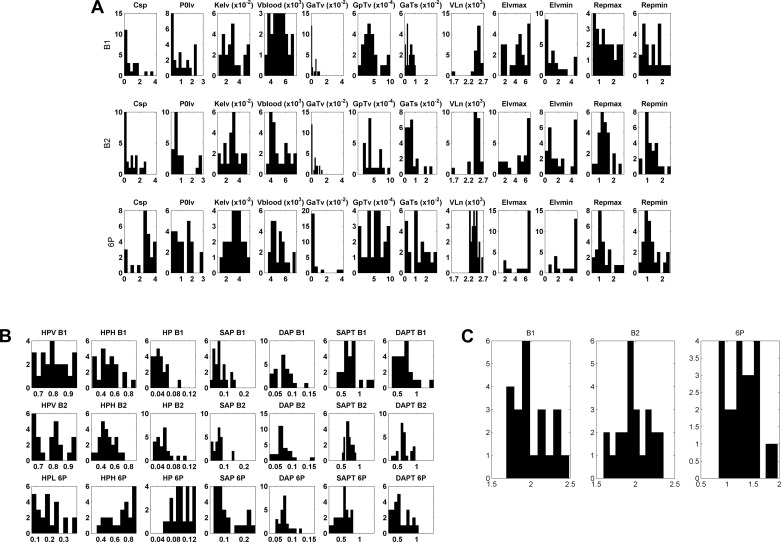
Fig. 3.
Distributions of the 12 optimized parameters (A), the optimized cost function terms (B), and the total cost function minima (C) for the baseline B1 and B2 tasks and the resonance breathing 6P task. Each parameter or term is presented in a separate panel. Parameter and term values are on the horizontal axis; frequency of observed values is on the vertical axis. See appendix a for definition of parameters.

