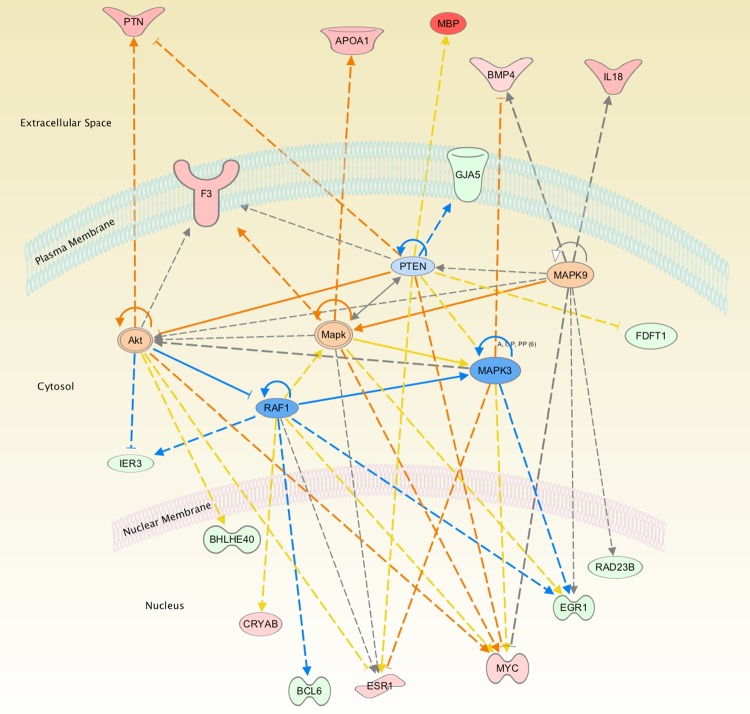
Fig. 2.
The network of genes identified by Ingenuity Pathway Analysis in ovine carotid arteries as a consequence of long-term hypoxia (LTH). The color red represents the upregulated genes, and green represents the downregulated genes. Orange and blue represent the activated and inhibited pathways, respectively, based on the Ingenuity Pathway Analysis. Yellow lines denote that the observed activation state was opposite to the activation state predicted by the available literature. Gray lines denote insufficient available data to predict activation state between the 2 molecules.

