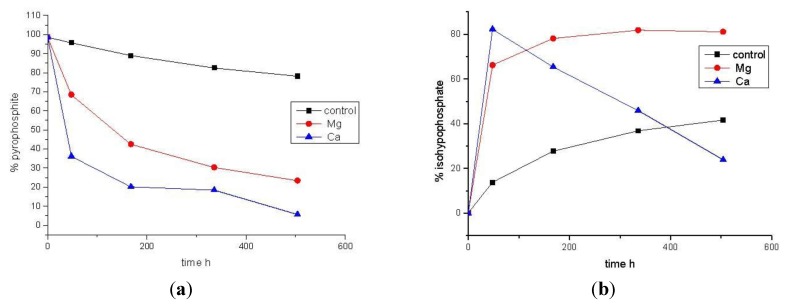
Figure 5.
Graphical representations of the data shown in Table 3 for (a) PPi(III) consumption; and (b) PPi(III–V) production, from aqueous solutions of PPi(III) and Pi(V) (both 50 mM, pH 7, 298 K) clearly revealing the acceleratory effect of both PPi(III–V) formation and, for Ca2+ especially, a clear acceleration of PPi(III–V) hydrolysis.

