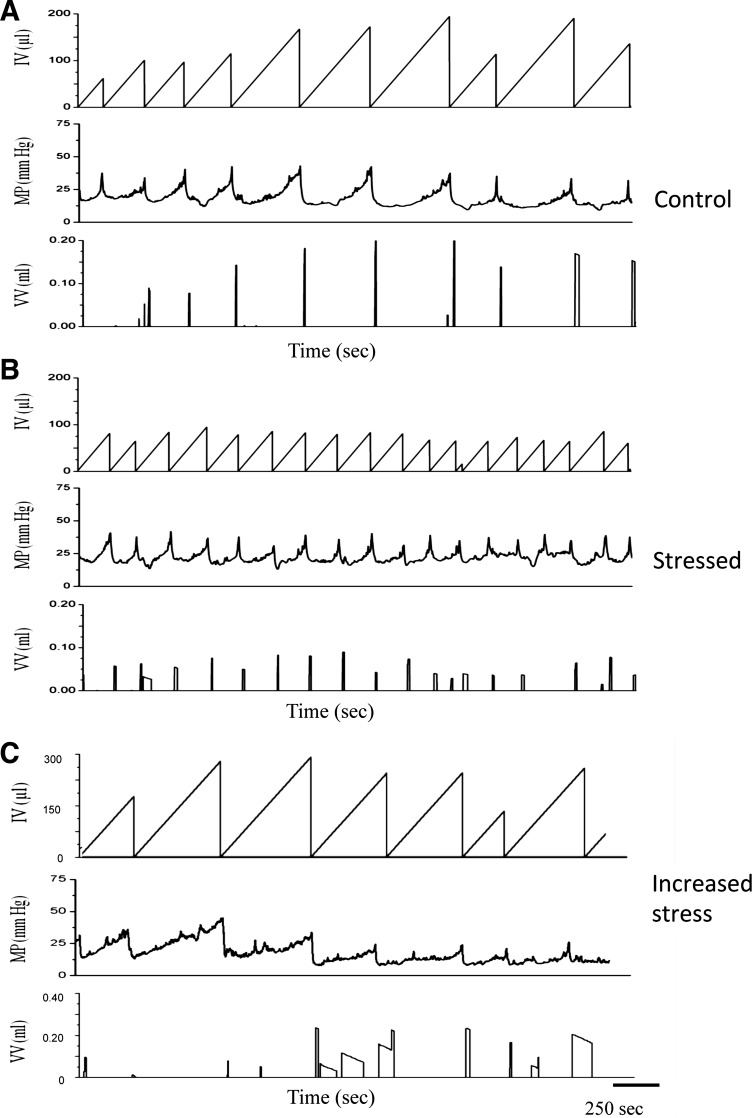
Fig. 1.
Cystometrogram traces of stress (S) and increased stress (IS) protocols in FVB mice. A: representative cystometry traces from control mice. B: representative cystometry traces after stress (2 wk). C: representative cystometry traces after increased stress (2 wk). IV, infused volume; MP, mean pressure; VV, voided volume. Social stress (B) significantly (P ≤ 0.01) increased voiding frequency and decreased bladder capacity (total infused saline at the start of micturition, 1.65-fold) and intercontraction intervals (1.65-fold) relative to control measurements (A).

