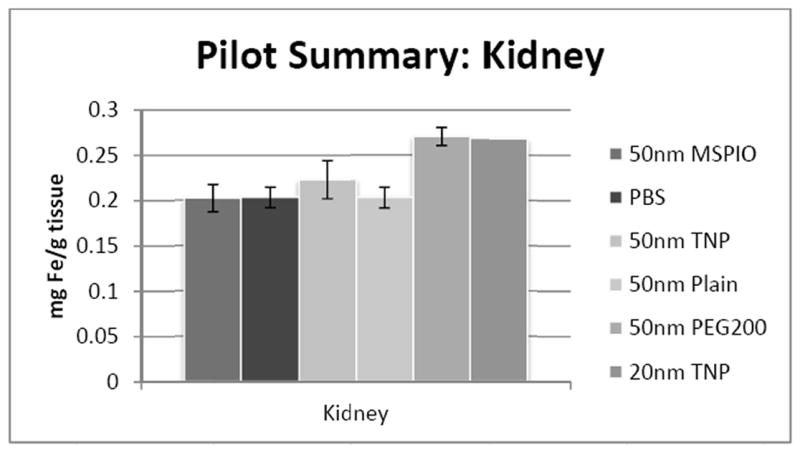
Figure 2.

ICP-MS-determined iron concentrations for mouse kidney tissue samples in mg iron per gram tissue mass. Mice were injected intravenously over a period of two injections, two hours apart, with 0.08 mg Fe/g mouse of the above variants of SPIO IONP and tissues harvested 24 hours post-second injection. All groups have N = 5-7 mice with the exception of the 20nm targeted nanoparticle data, where N = 1 and injected dose was lower at 0.05 mg Fe/g mouse. Error bars are standard error.
