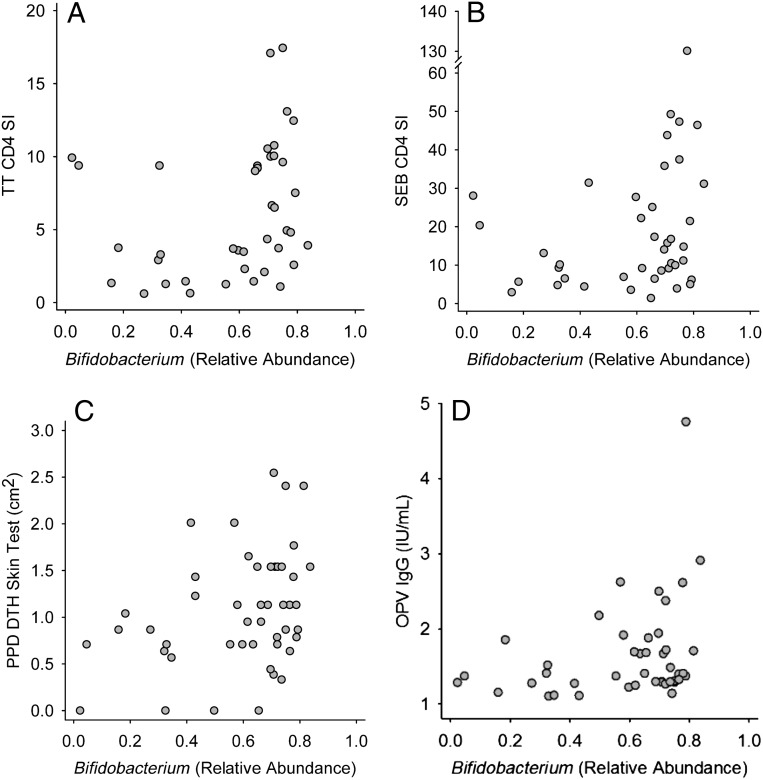
FIGURE 4.
Positive association of vaccine responses with relative abundance of stool Bifidobacterium determined by sequence analysis of the 16S rRNA gene. Vaccine responses were characterized by CD4 stimulation index response to TT (A), CD4 stimulation index in response to the polyclonal T-cell mitogen SEB (B), the DTH skin-test response to PPD antigen as an index of the response to BCG immunization (C), and the IgG response to the OPV vaccine (D). Spearman correlation coefficients (R) and P values were as follows: A, R = 0.389, P = .013; B, R = 0.315, P = .045; C, R = 0.337, P = .020; and D, R = 0.301, P = .047.

