
FIG. 2.
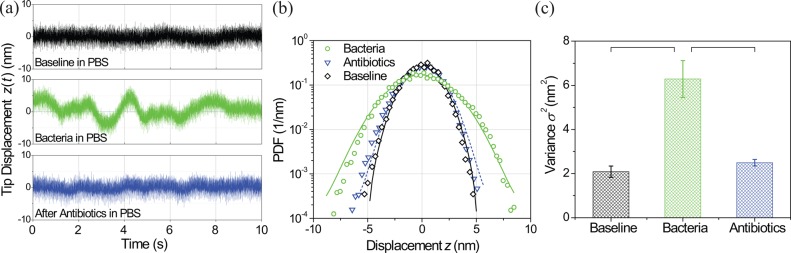
(a) Time domain measurement of the microcantilever fluctuations. The top (black) trace is the baseline cantilever fluctuations with no bacteria present in PBS, i.e., the equilibrium value. The middle (green) trace is the same measurement after bacteria have adhered to the cantilever surface in a 108 CFU/ml solution. The data in Fig. 1(b) and the cantilever area suggest that the signal comes from ∼102 bacteria on the microcantilever. The bottom (blue) trace is after the bacteria are killed in an antibiotic solution. (b) Probability density function of the three time signals shown in (a) with Gaussian fits. (c) Variance of the microcantilever fluctuations measured from the three data traces in (a). These values match those obtained from the Gaussian fits in (b). Data are indicated as averages ± standard deviations. Brackets represent groups which were compared in the statistical analysis (details in supplementary material,24 Sec. 2.2).