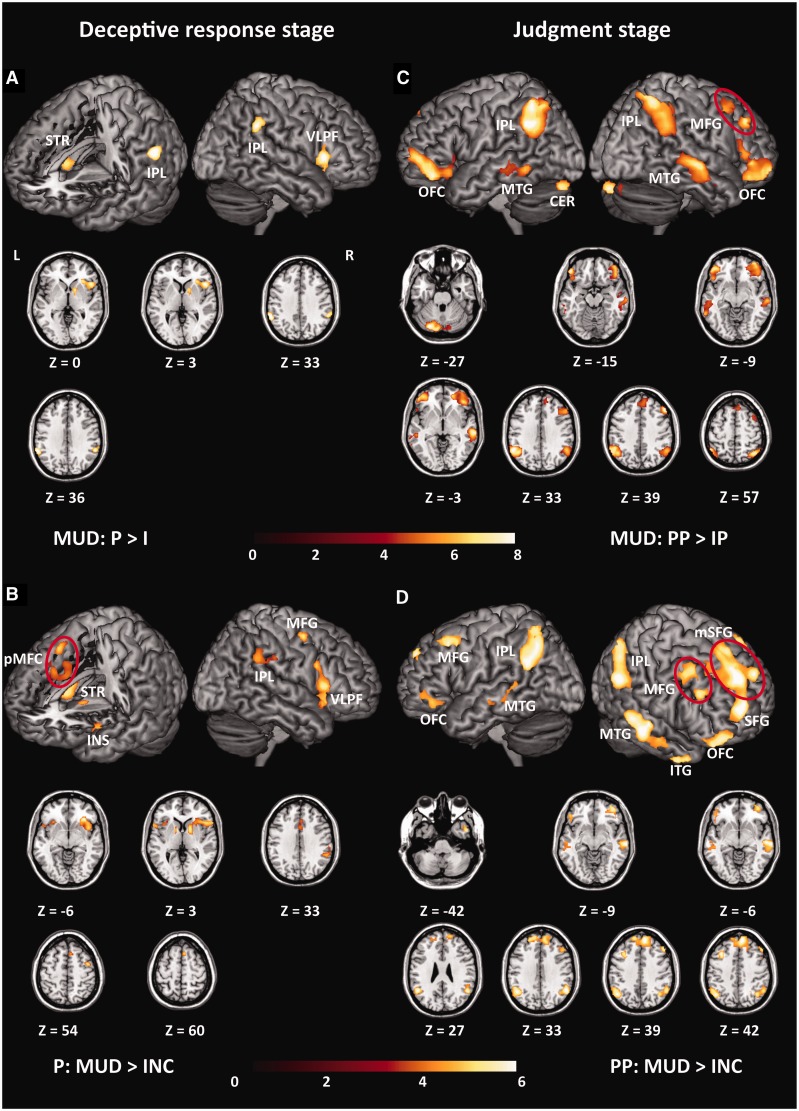
Fig. 2.
All of the significant clusters of contrast analyses. When not specified otherwise, data are thresholded at FDR < 0.005, K > 50. (A) Brain regions showed greater activity for the probes than for the irrelevants in the MUD group. (B) Brain regions responding to the probes showed stronger activities in the MUD group than in the INC group. Data are thresholded at FDR < 0.05, K > 50 for exploratory purpose. (C) Brain regions showed stronger activities for the positive judgment following probes than irrelevants in the MUD group. (D) Brain regions responding to positive judgment following probes showed stronger activities in the MUD group than in the INC group. Within each sub-figure, all of the significant clusters were shown on the surface-rendered brain; additionally, they were also shown in axial (Z) views at the peak effect coordinates.

