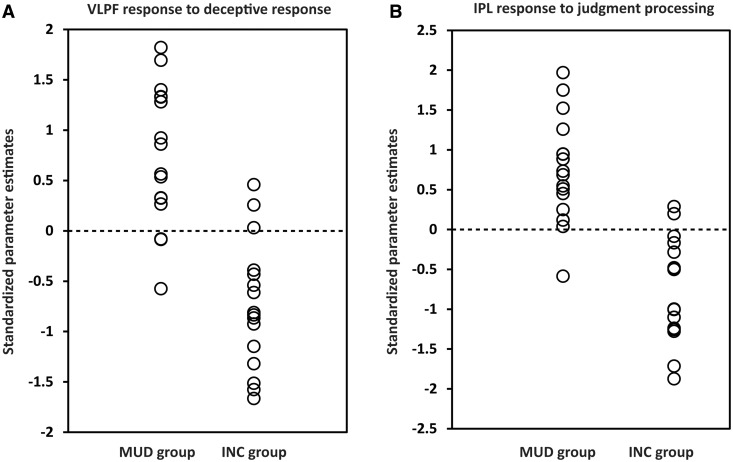
Fig. 3.
Individual diagnosis results. (A) Results of discriminant analysis based on the activities of the right VLPF in the deceptive response stage. The dots indicate standardized parameter estimates of each participant responding to the probes in the right VLPF. (B) Results of discriminant analysis based on the activities of the right IPL in the judgment stage. The dots indicate standardized parameter estimates of each participant responding to the positive judgments following probes in the right IPL. In both (A) and (B), the dotted line represents the value of the threshold for the classification (canonical coefficient, 0.756; eigenvalue, 1.331; Wilks’ Lambda, 0.429; P < 0.001 for the deceptive response stage, and canonical coefficient, 0.769; eigenvalue, 1.450; Wilks’ Lambda, 0.408; P < 0.001 for the judgment processing stage).

