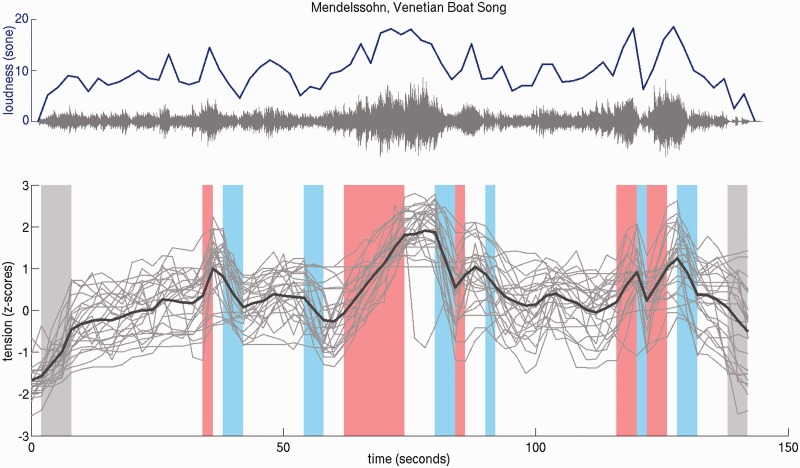
Fig. 1.
Top: Audio waveform (gray) and loudness (blue) of the Mendelssohn piece. Bottom: Individual (gray lines) and average (black line) tension ratings (N = 25). Shaded areas highlight time intervals that were modelled as increasing (red) and decreasing (blue) tension (gray shaded areas were excluded from data analysis because tension effects are confounded by music onset or ending). Loudness and tension ratings were downsampled to 1/2 Hz to match the time intervals of image acquisition. Note the similarity of loudness and the tension profile, and that, therefore, loudness was controlled by including it as regressor in the model used for data evaluation.

