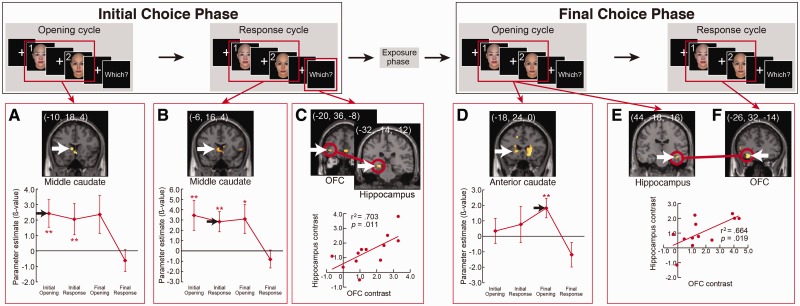
Fig. 4.
Significant activity contrasts and correlations at successive cycles of the Changed Choice trails. Initial choice phase and Final choice phase trials were analyzed separately. White arrows indicate the peak voxels in the caudate, the hippocampus and the OFC. (A, D) The bottom graphs show the time course of caudate activity. (C, E, F) Red circles indicate a significant correlation of contrast levels between the hippocampus and OFC, and subject-by-subject plot of contrast levels in hippocampal vs OFC ROIs. To define the activated regions, a statistical threshold at P < 0.005 (uncorrected) was used. ***P < 0.001, **P < 0.005, *P < 0.01.

