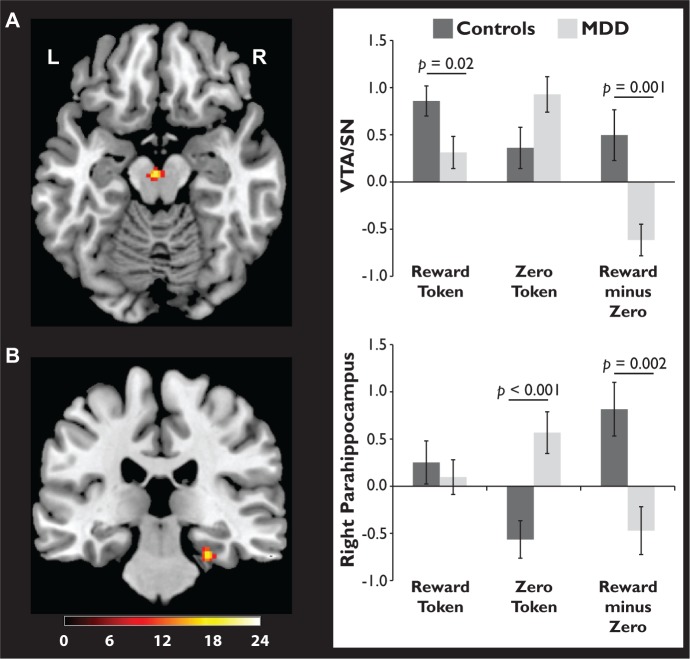
Fig. 3.
Group differences in the response to reward and zero tokens were observed in the (A) VTA/SN and (B) right parahippocampus. fMRI data are thresholded at P < 0.005 (uncorrected); the scale bar corresponds to F values for the Group × Stimulus × Token Type interaction. Bar graphs (with standard error bars) show beta weights for reward and zero tokens vs fixation, plus the difference between them.

