
Table 1.
Summary of HIV surveillance cases, annual total program cost, and cost per case using micro-costing data collected from August to November 2011 in Michigan
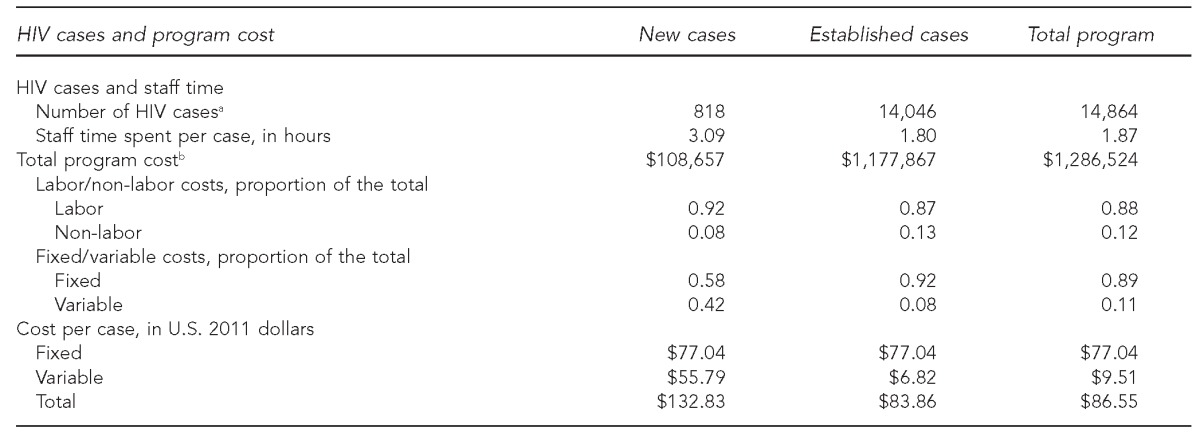
aSurveillance data represent new HIV cases reported during 2009 and established cases as of December 2009 based on: Centers for Disease Control and Prevention (US). Diagnoses of HIV infection and AIDS in the United States and dependent areas, 2010. HIV Surveill Rep 2012;22:1-79.
bIncludes the fixed minimum costs. All costs are expressed in 2011 U.S. dollars.
HIV = human immunodeficiency virus