
Table 4.
Mean factor score differences and 95% CIs from GEE linear models for odors from liquid TSS, cake TSS, and livestock for North Carolina residents (n=430) who participated in a study of odors from TSS and livestock and self-reported health, 2010
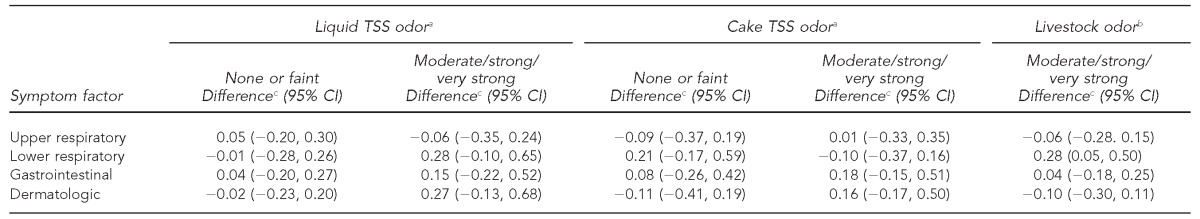
aResidents of the comparison areas were the referent group for none or faint and moderate/strong/very strong TSS odor.
bResidents who reported no or faint livestock odor were the referent group for moderate/strong/very strong livestock odor.
cFactor score differences were adjusted for age, race, gender, education, smoking, passive smoking, agricultural chemical odors, and odors from burning. A positive score indicates higher symptom reporting among the exposed.
CI = confidence interval
GEE = generalized estimating equation
TSS = treated sewage sludge