
Table 5.
Prevalence ratios and 95% CIs from GEE models for odors from livestock, liquid TSS, and cake TSS for North Carolina residents (n=430) who participated in a study of odors from TSS and livestock and self-reported health, 2010
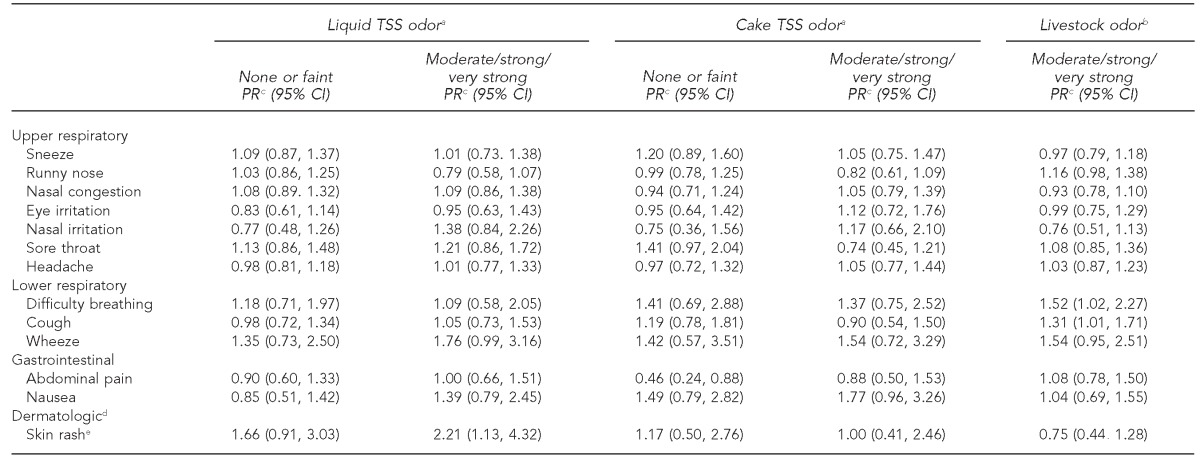
aResidents of the comparison areas were the referent group for none or faint and moderate/strong/very strong TSS odor.
bResidents who reported no or faint livestock odor were the referent group for moderate/strong/very strong livestock odor.
cPR adjusted for age, race, gender, education, smoking, passive smoking, agricultural chemical odors, and odors from burning.
dSkin ulcer was also in this factor group, but the model for this symptom did not converge due to the small number of cases.
ePresent if ever reported in the past six months
CI = confidence interval
GEE = general estimating equation
TSS = treated sewage sludge
PR = prevalence ratio