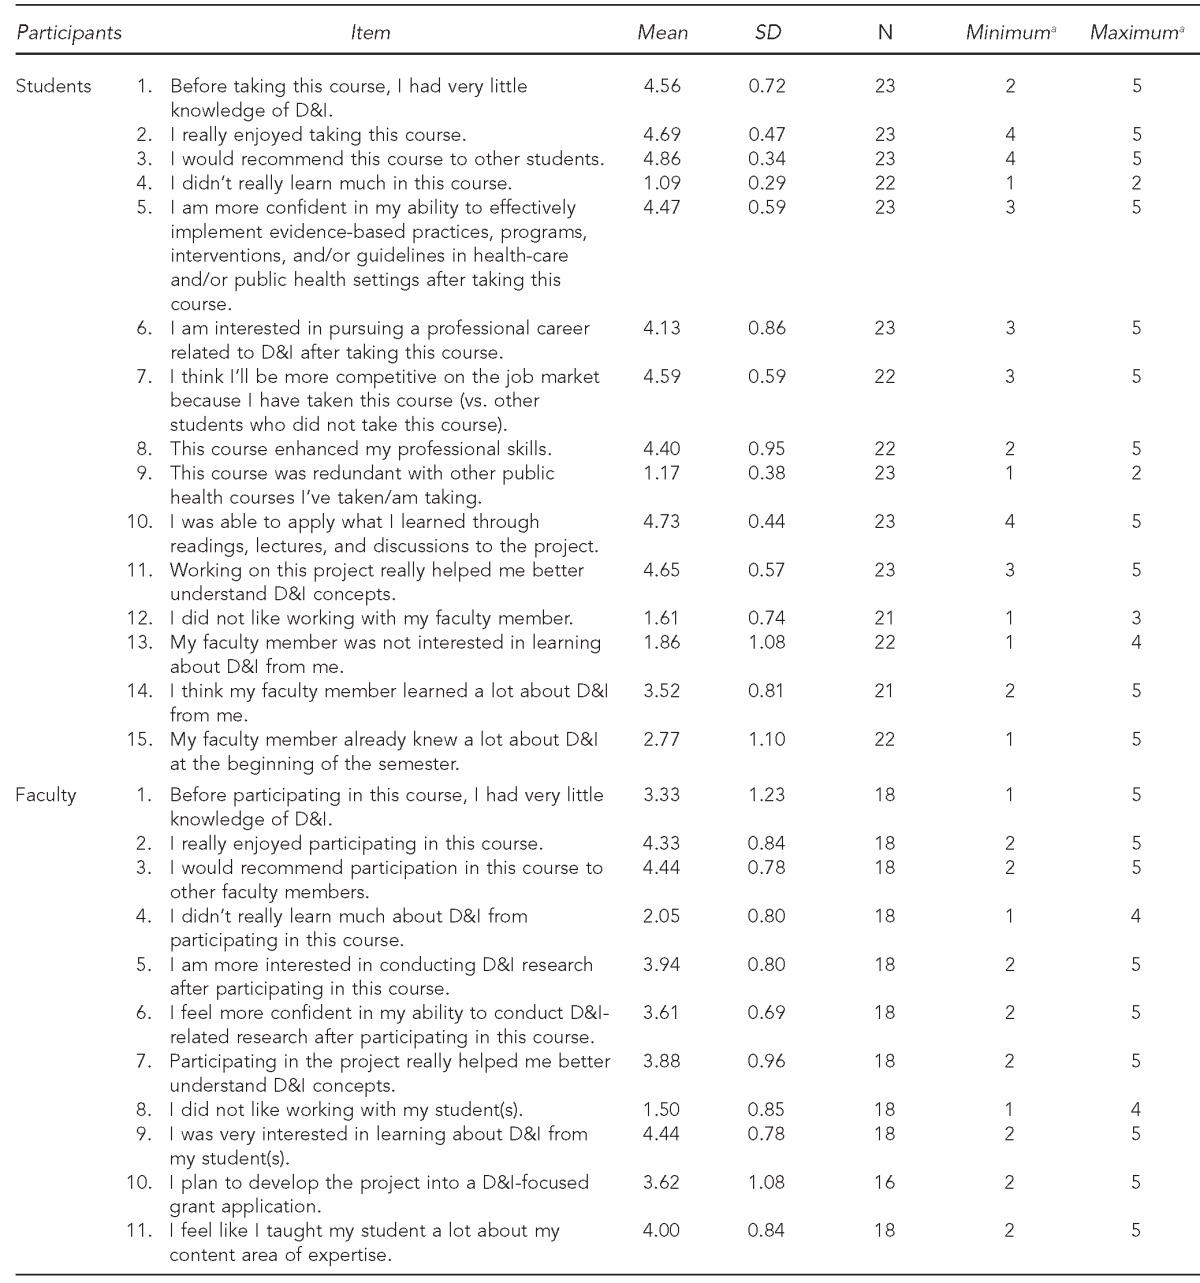
Table 2.
Evaluation from participating students (n=23) and faculty (n=18) in the Dissemination and Implementation in Health course, University of Alabama at Birmingham School of Public Health: fall 2012 and fall 2013 semesters

aResponse options included 1 = strongly disagree, 2 = disagree, 3 = neither agree nor disagree, 4 = agree, 5 = strongly agree.
SD = standard deviation
D&I = dissemination and implementation
