
Table 1.
Comparison of percent correct on PFA test between pre- and post-training test administrations to participants in rural, urban, and all cohortsa in Illinois, Iowa, and Maryland, March 2010–June 2012
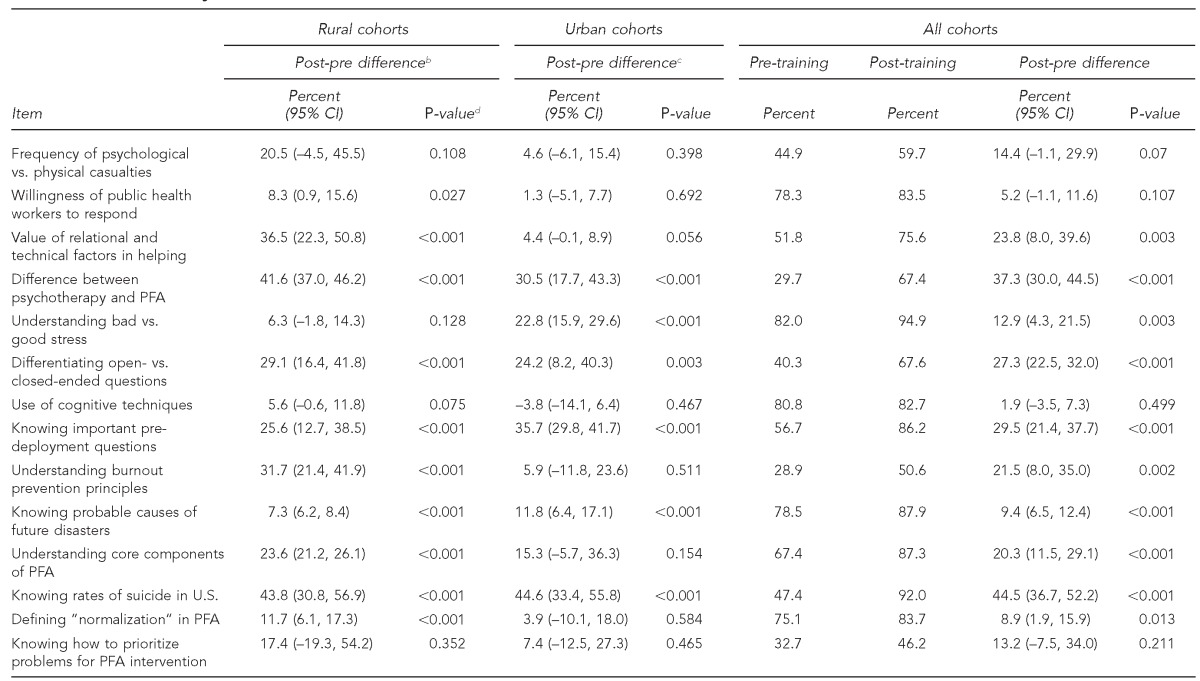
Rural cohorts included Cambridge and Centreville, Maryland, and Cedar Rapids, Iowa. Urban cohorts included Baltimore and Turner Station, Maryland, and Chicago, Illinois.
bThe number of respondents for rural cohorts pre-training ranged from 87 to 109, and for post-training ranged from 104 to 107 across these questions.
cThe number of respondents for urban cohorts pre-training ranged from 68 to 76, and for post-training ranged from 67 to 69 across these questions.
dP-values are based on two-sample (administration) tests, as responses were not matched for all cohorts.
PFA = psychological first aid
CI = confidence interval