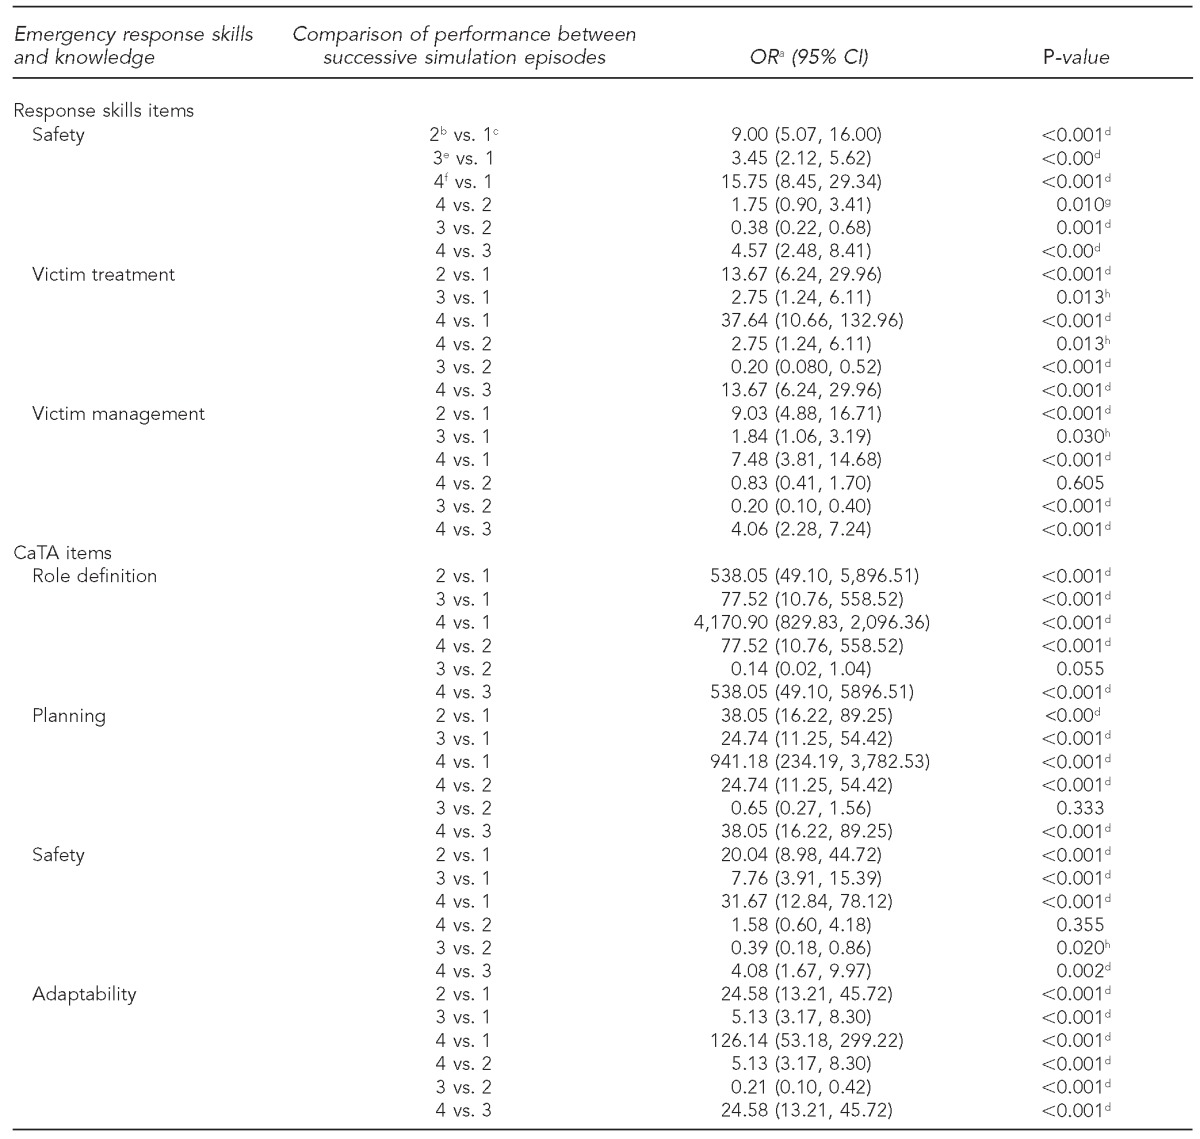
Table 2.
Training impact on performance during successive simulation experiences in the Disaster 101 workshop: University of Minnesota (Twin Cities campus), 2009–2012

aORs were calculated to measure the association between the exposure to training (i.e., realistic simulated scenarios with focused feedback from interprofessional facilitator teams) and improved team performance.
bFirst simulated disaster event, second trial
cFirst simulated disaster event, first trial
dSignificant at p<0.001
eSecond simulated disaster event, first trial
fSecond simulated disaster event, second trial
gSignificant at p<0.01
hSignificant at p<0.05
OR = odds ratio
CI = confidence interval
CaTA = communication and teamwork assessment
