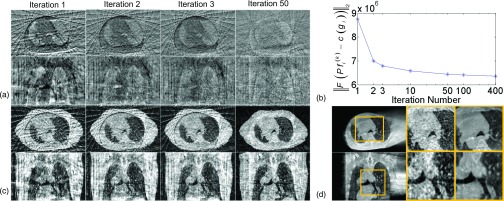
FIG. 4.

Intermediate results during reconstructing the 0% phase of 4D-CBCT using the 0% phase of p-CT (Patient 1). (a) The difference images after 1, 2, 3, and 50 iterations. Display window: [−700, 700] HU. (b) as a function of iteration steps, with the x-axis in a log scale. (c) The si images after 1, 2, 3, and 50 iterations. (d) Zoomed-in ROIs to compare the si image after 50 iterations and the FDK-based 4D-CBCT (4-min scan). ROIs are indicated by the box. The three columns are FDK image, zoomed-in view of si, and the zoomed-in view of FDK image. In subfigures (a), (c), and (d), the upper and the bottom rows show the transverse and the sagittal view, respectively.
