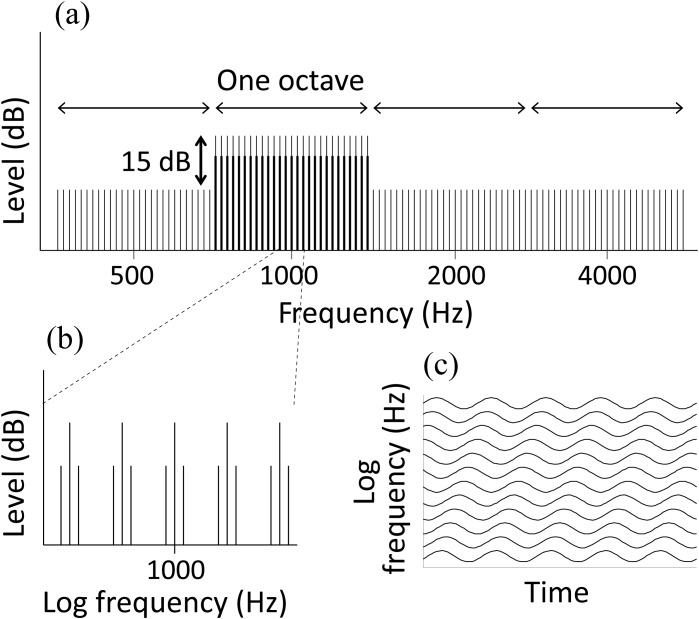
FIG. 1.
(a) A schematic of the STM stimulus generation method in the spectral domain, showing the carrier components and sidebands in the modulated octave band centered at 1000 Hz and the unmodulated components 15 dB lower in level in the remaining octave bands. (b) A close-up view of the portion of the spectrum near the center of the modulated octave band, showing the carrier components and modulation sidebands. (c) A schematic of the temporal envelope waveforms associated with successive carrier components illustrating how relative shifts in the phases of the spectral envelopes generate modulation in the spectral domain.

