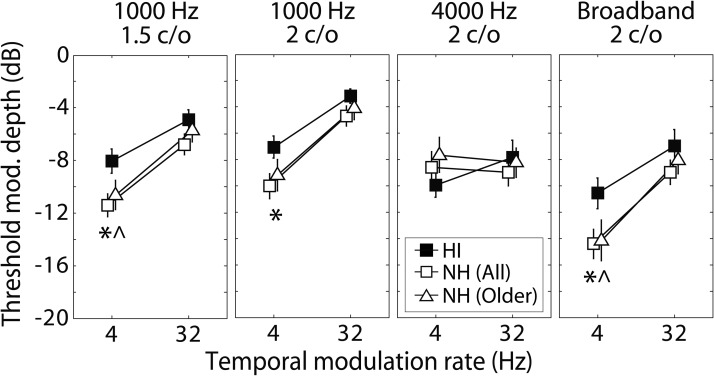
FIG. 7.
The results of experiment 2 showing STM sensitivity with spectral-edge cues removed. Group-mean STM detection thresholds are plotted as function of temporal modulation rate. Asterisks indicate conditions where performance was significantly different between HI and full NH listener groups. Carets ( ^) indicate conditions where performance was significantly different between the HI listeners and the age-matched subgroup of NH listeners.

