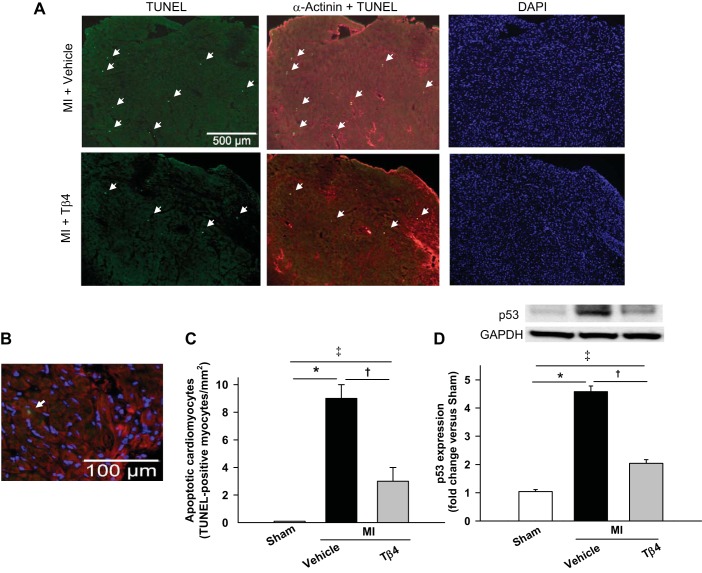
Fig. 5.
A: representative images of TUNEL-positive myocytes in the left ventricular (LV) myocardium. TUNEL-positive nuclei are shown in bright green, cardiomyocytes in red (α-actinin), and nuclei in blue [4′,6-diamidino-2-phenylindole (DAPI)]. No clear TUNEL-positive myocytes were found in the sham heart. Numbers of positive cells increased significantly at 7 days post-MI, which were reduced by Tβ4. B: representative merged image showing TUNEL-positive myocytes (white arrow). C: quantitative analysis of the number of TUNEL-positive myocytes. D: p53 expression in the myocardium was markedly induced after MI, which was significantly downregulated by Tβ4 treatment. n = 6–8 animals/group. *P < 0.005; †P < 0.005; ‡P < 0.005.

