Figure 1. .
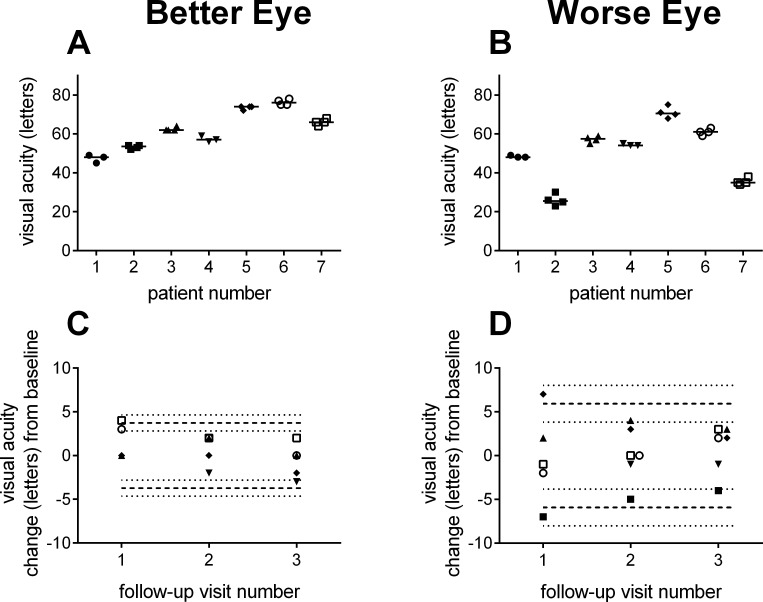
Visual acuity. Replicate visual acuity measurements by subject for the Better (A) and Worse Eye (B) groups. Change in visual acuity measurements at follow-up visits relative to baseline for Better (C) and Worse Eye (D) groups. Dashed lines indicate the range of variability described by the RCs. The dotted lines show the 95% CIs for the RCs. Symbols are offset in each graph for clarity.

